

108
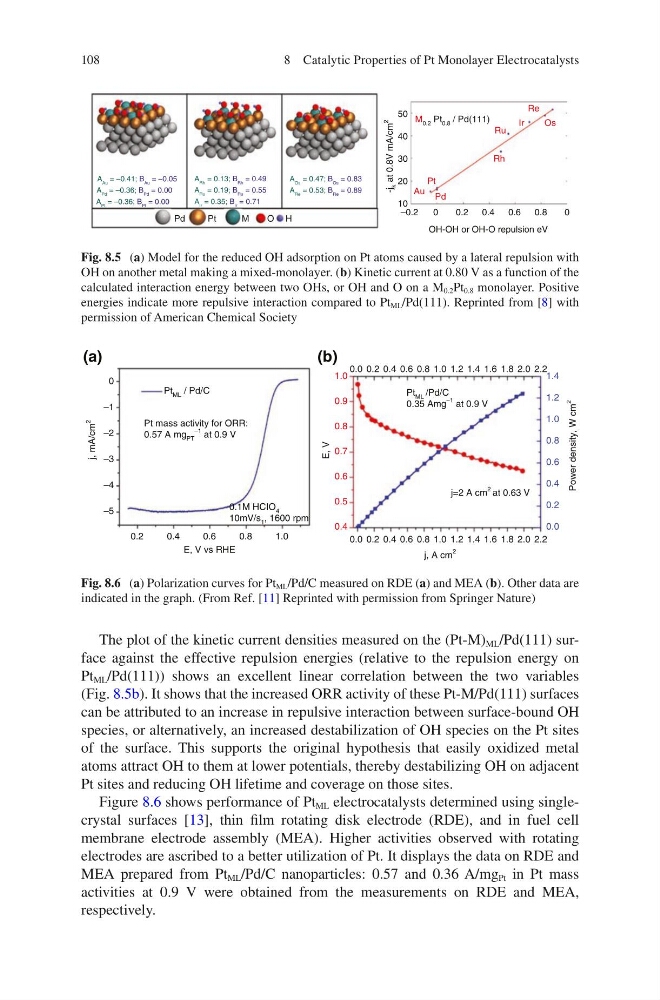
The plot of the kinetic current densities measured on the (Pt-M) ML /Pd(111) surface against the effective repulsion energies (relative to the repulsion energy on
Pt ML /Pd(111)) shows an excellent linear correlation between the two variables
(Fig. 8.5b). It shows that the increased ORR activity of these Pt-M/Pd(111) surfaces
can be attributed to an increase in repulsive interaction between surface-bound OH
species, or alternatively, an increased destabilization of OH species on the Pt sites
of the surface. This supports the original hypothesis that easily oxidized metal
atoms attract OH to them at lower potentials, thereby destabilizing OH on adjacent
Pt sites and reducing OH lifetime and coverage on those sites.
Figure 8.6 shows performance of Pt ML electrocatalysts determined using singlecrystal surfaces [13], thin film rotating disk electrode (RDE), and in fuel cell
membrane electrode assembly (MEA). Higher activities observed with rotating
electrodes are ascribed to a better utilization of Pt. It displays the data on RDE and
MEA prepared from Pt ML /Pd/C nanoparticles: 0.57 and 0.36 A/mg Pt in Pt mass
activities at 0.9 V were obtained from the measurements on RDE and MEA,
respectively.
50
40
30
20
10
-j
k
at 0.8V mA/cm
2
–0.2
0
0.2
0.4
0.6
0.8
0
OH-OH or OH-O repulsion eV
Au
Pt
Pd
Rh
Ru
Ir
Os
Re
M 0.2 Pt 0.8 / Pd(111)
Pd
Pt
M
O H
A Au = –0.41; B Au = –0.05
A Pd = –0.36; B Pd = 0.00
A Pt = –0.36; B Pt = 0.00
A Rh = 0.13; B Rh = 0.49
A Ru = 0.19; B Ru = 0.55
A Os = 0.47; B Os = 0.83
A Re = 0.53; B Re = 0.89
A Ir = 0.35; B Ir = 0.71
Fig. 8.5 (a) Model for the reduced OH adsorption on Pt atoms caused by a lateral repulsion with
OH on another metal making a mixed-monolayer. (b) Kinetic current at 0.80 V as a function of the
calculated interaction energy between two OHs, or OH and O on a M 0.2 Pt 0.8 monolayer. Positive
energies indicate more repulsive interaction compared to Pt ML /Pd(111). Reprinted from [8] with
permission of American Chemical Society
(a)
(b)
0
–1
–2
–3
–4
–5
0.2
0.4
0.6
0.8
1.0
E, V vs RHE
Pt mass activity for ORR:
0.57 A mg PT
–1 at 0.9 V
Pt ML /Pd/C
0.35 Amg
–1 at 0.9 V
Pt ML / Pd/C
j, mA/cm
2
j, A cm
2
Power density, W cm
2
j=2 A cm
2 at 0.63 V
0.1M HCIO 4
10mV/s 1 , 1600 rpm
1.0
0.9
0.8
0.7
0.6
0.5
0.4
E, V
0.0 0.2 0.4 0.6 0.8 1.0 1.2 1.4 1.6 1.8 2.0 2.2
0.0 0.2 0.4 0.6 0.8 1.0 1.2 1.4 1.6 1.8 2.0 2.2
1.4
1.2
1.0
0.8
0.6
0.4
0.2
0.0
Fig. 8.6 (a) Polarization curves for Pt ML /Pd/C measured on RDE (a) and MEA (b). Other data are
indicated in the graph. (From Ref. [11] Reprinted with permission from Springer Nature)
8 Catalytic Properties of Pt Monolayer Electrocatalysts
The plot of the kinetic current densities measured on the (Pt-M) ML /Pd(111) surface against the effective repulsion energies (relative to the repulsion energy on
Pt ML /Pd(111)) shows an excellent linear correlation between the two variables
(Fig. 8.5b). It shows that the increased ORR activity of these Pt-M/Pd(111) surfaces
can be attributed to an increase in repulsive interaction between surface-bound OH
species, or alternatively, an increased destabilization of OH species on the Pt sites
of the surface. This supports the original hypothesis that easily oxidized metal
atoms attract OH to them at lower potentials, thereby destabilizing OH on adjacent
Pt sites and reducing OH lifetime and coverage on those sites.
Figure 8.6 shows performance of Pt ML electrocatalysts determined using singlecrystal surfaces [13], thin film rotating disk electrode (RDE), and in fuel cell
membrane electrode assembly (MEA). Higher activities observed with rotating
electrodes are ascribed to a better utilization of Pt. It displays the data on RDE and
MEA prepared from Pt ML /Pd/C nanoparticles: 0.57 and 0.36 A/mg Pt in Pt mass
activities at 0.9 V were obtained from the measurements on RDE and MEA,
respectively.
50
40
30
20
10
-j
k
at 0.8V mA/cm
2
–0.2
0
0.2
0.4
0.6
0.8
0
OH-OH or OH-O repulsion eV
Au
Pt
Pd
Rh
Ru
Ir
Os
Re
M 0.2 Pt 0.8 / Pd(111)
Pd
Pt
M
O H
A Au = –0.41; B Au = –0.05
A Pd = –0.36; B Pd = 0.00
A Pt = –0.36; B Pt = 0.00
A Rh = 0.13; B Rh = 0.49
A Ru = 0.19; B Ru = 0.55
A Os = 0.47; B Os = 0.83
A Re = 0.53; B Re = 0.89
A Ir = 0.35; B Ir = 0.71
Fig. 8.5 (a) Model for the reduced OH adsorption on Pt atoms caused by a lateral repulsion with
OH on another metal making a mixed-monolayer. (b) Kinetic current at 0.80 V as a function of the
calculated interaction energy between two OHs, or OH and O on a M 0.2 Pt 0.8 monolayer. Positive
energies indicate more repulsive interaction compared to Pt ML /Pd(111). Reprinted from [8] with
permission of American Chemical Society
(a)
(b)
0
–1
–2
–3
–4
–5
0.2
0.4
0.6
0.8
1.0
E, V vs RHE
Pt mass activity for ORR:
0.57 A mg PT
–1 at 0.9 V
Pt ML /Pd/C
0.35 Amg
–1 at 0.9 V
Pt ML / Pd/C
j, mA/cm
2
j, A cm
2
Power density, W cm
2
j=2 A cm
2 at 0.63 V
0.1M HCIO 4
10mV/s 1 , 1600 rpm
1.0
0.9
0.8
0.7
0.6
0.5
0.4
E, V
0.0 0.2 0.4 0.6 0.8 1.0 1.2 1.4 1.6 1.8 2.0 2.2
0.0 0.2 0.4 0.6 0.8 1.0 1.2 1.4 1.6 1.8 2.0 2.2
1.4
1.2
1.0
0.8
0.6
0.4
0.2
0.0
Fig. 8.6 (a) Polarization curves for Pt ML /Pd/C measured on RDE (a) and MEA (b). Other data are
indicated in the graph. (From Ref. [11] Reprinted with permission from Springer Nature)
8 Catalytic Properties of Pt Monolayer Electrocatalysts