

97
mass transport and kinetics control, it is often possible to obtain both the diffusion
coefficient and the standard rate constant, k
0
, from this study. An important relation
was derived from a Levich equation by plotting the reciprocal of the limiting current
as a function of ω
−1/2
.:
1
1
1 2
/
/
/
j
j B
L =
+
−
ω
(7.2)
where B is a constant: 0.61 n FAD O
2/3
v
-1/6
C O .
A plot of 1/j versus ω
−1/2
, a so-called Koutecky–Levich plot, gives a straight line
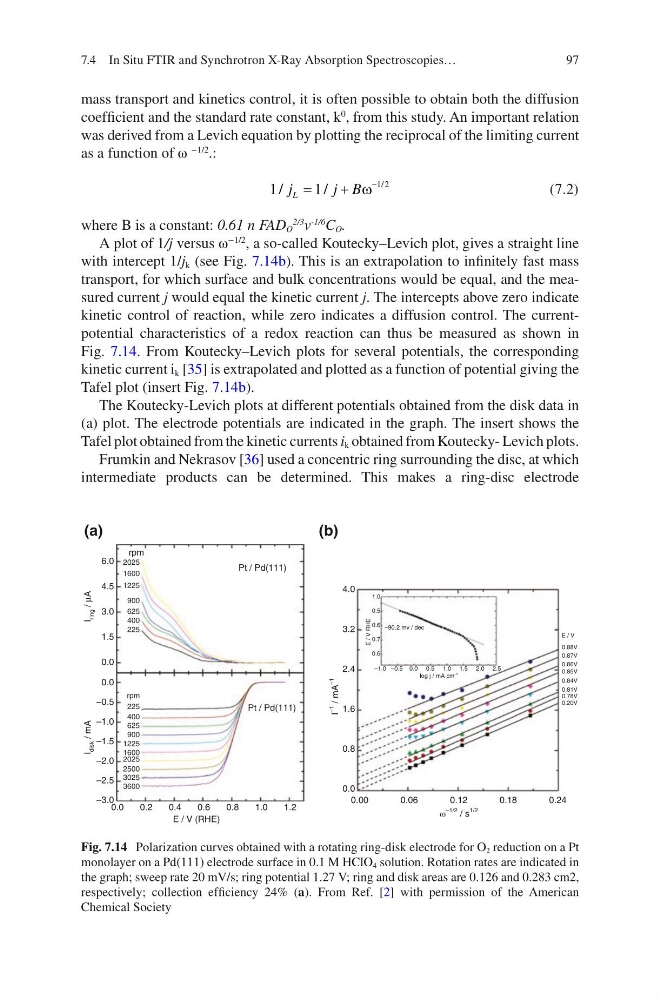
with intercept 1/j k (see Fig. 7.14b). This is an extrapolation to infinitely fast mass
transport, for which surface and bulk concentrations would be equal, and the measured current j would equal the kinetic current j. The intercepts above zero indicate
kinetic control of reaction, while zero indicates a diffusion control. The currentpotential characteristics of a redox reaction can thus be measured as shown in
Fig. 7.14. From Koutecky–Levich plots for several potentials, the corresponding
kinetic current i k [35] is extrapolated and plotted as a function of potential giving the
Tafel plot (insert Fig. 7.14b).
The Koutecky-Levich plots at different potentials obtained from the disk data in
(a) plot. The electrode potentials are indicated in the graph. The insert shows the
Tafel plot obtained from the kinetic currents i k obtained from Koutecky- Levich plots.
Frumkin and Nekrasov [36] used a concentric ring surrounding the disc, at which
intermediate products can be determined. This makes a ring-disc electrode
6.0
4.5
3.0
1.5
0.0
0.0
–0.5
–1.0
–1.5
–2.0
–2.5
–3.0
rpm
2025
1600
1225
900
625
400
225
Pt / Pd(111)
Pt / Pd(111)
rpm
225
400
625
900
1225
1600
2025
2500
3025
3600
0.0
0.2
0.4
0.6
0.8
1.0
1.2
E / V (RHE)
4.0
3.2
2.4
1.6
0.8
0.0
0.00
0.06
0.12
0.18
0.24
1.0
0.5
0.6
0.7
0.6
–1.0 –0.5 0.0 0 .5 1.0 1 .5 2.0 2 .5
log j / mA cm –3
E / V RHE
–90.2 mv / dec
E / V
0.88V
0.87V
0.86V
0.85V
0.84V
0.81V
0.78V
0.20V
I
–1
/ mA
–1
I
ring
/
µA
I
disk
/ mA
ω
–1/2 / s
1/2
(a)
(b)
Fig. 7.14 Polarization curves obtained with a rotating ring-disk electrode for O 2 reduction on a Pt
monolayer on a Pd(111) electrode surface in 0.1 M HClO 4 solution. Rotation rates are indicated in
the graph; sweep rate 20 mV/s; ring potential 1.27 V; ring and disk areas are 0.126 and 0.283 cm2,
respectively; collection efficiency 24% (a). From Ref. [2] with permission of the American
Chemical Society
7.4 In Situ FTIR and Synchrotron X-Ray Absorption Spectroscopies…
mass transport and kinetics control, it is often possible to obtain both the diffusion
coefficient and the standard rate constant, k
0
, from this study. An important relation
was derived from a Levich equation by plotting the reciprocal of the limiting current
as a function of ω
−1/2
.:
1
1
1 2
/
/
/
j
j B
L =
+
−
ω
(7.2)
where B is a constant: 0.61 n FAD O
2/3
v
-1/6
C O .
A plot of 1/j versus ω
−1/2
, a so-called Koutecky–Levich plot, gives a straight line
with intercept 1/j k (see Fig. 7.14b). This is an extrapolation to infinitely fast mass
transport, for which surface and bulk concentrations would be equal, and the measured current j would equal the kinetic current j. The intercepts above zero indicate
kinetic control of reaction, while zero indicates a diffusion control. The currentpotential characteristics of a redox reaction can thus be measured as shown in
Fig. 7.14. From Koutecky–Levich plots for several potentials, the corresponding
kinetic current i k [35] is extrapolated and plotted as a function of potential giving the
Tafel plot (insert Fig. 7.14b).
The Koutecky-Levich plots at different potentials obtained from the disk data in
(a) plot. The electrode potentials are indicated in the graph. The insert shows the
Tafel plot obtained from the kinetic currents i k obtained from Koutecky- Levich plots.
Frumkin and Nekrasov [36] used a concentric ring surrounding the disc, at which
intermediate products can be determined. This makes a ring-disc electrode
6.0
4.5
3.0
1.5
0.0
0.0
–0.5
–1.0
–1.5
–2.0
–2.5
–3.0
rpm
2025
1600
1225
900
625
400
225
Pt / Pd(111)
Pt / Pd(111)
rpm
225
400
625
900
1225
1600
2025
2500
3025
3600
0.0
0.2
0.4
0.6
0.8
1.0
1.2
E / V (RHE)
4.0
3.2
2.4
1.6
0.8
0.0
0.00
0.06
0.12
0.18
0.24
1.0
0.5
0.6
0.7
0.6
–1.0 –0.5 0.0 0 .5 1.0 1 .5 2.0 2 .5
log j / mA cm –3
E / V RHE
–90.2 mv / dec
E / V
0.88V
0.87V
0.86V
0.85V
0.84V
0.81V
0.78V
0.20V
I
–1
/ mA
–1
I
ring
/
µA
I
disk
/ mA
ω
–1/2 / s
1/2
(a)
(b)
Fig. 7.14 Polarization curves obtained with a rotating ring-disk electrode for O 2 reduction on a Pt
monolayer on a Pd(111) electrode surface in 0.1 M HClO 4 solution. Rotation rates are indicated in
the graph; sweep rate 20 mV/s; ring potential 1.27 V; ring and disk areas are 0.126 and 0.283 cm2,
respectively; collection efficiency 24% (a). From Ref. [2] with permission of the American
Chemical Society
7.4 In Situ FTIR and Synchrotron X-Ray Absorption Spectroscopies…