

152
7 Virtual testing approach for sandwich panel joints
with the shear test model. The load is applied via a rigid plate which is prescribed a constant velocity compressing the joint based on a penalty contact. All implemented material models and contact definitions are identical to the L-joint shear tests.
a)
b)
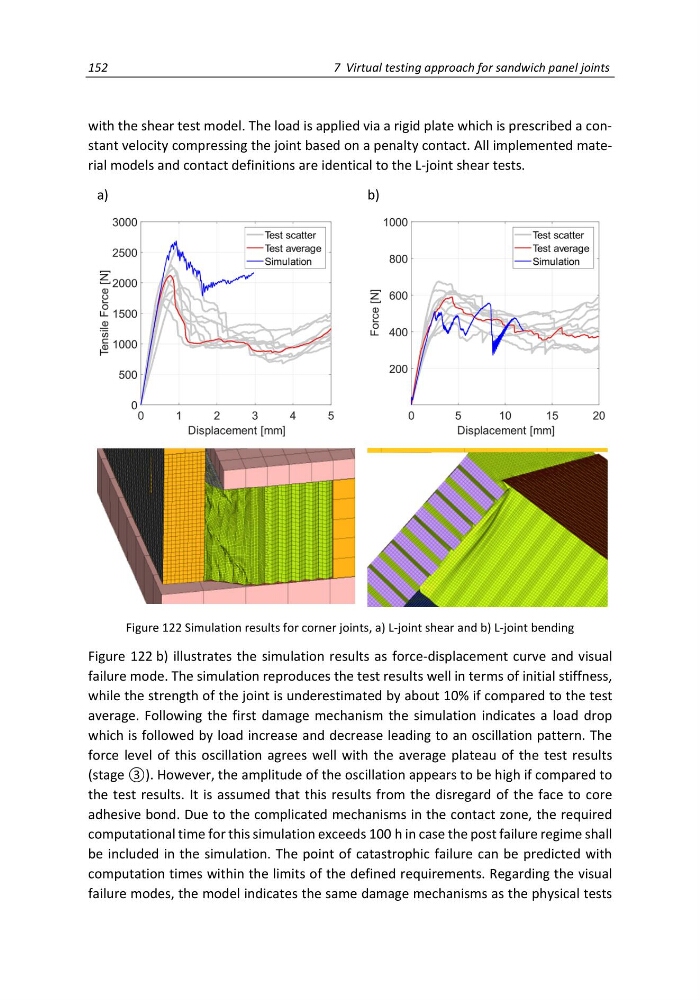
Figure 122 Simulation results for corner joints, a) L-joint shear and b) L-joint bending
Figure 122 b) illustrates the simulation results as force-displacement curve and visual
failure mode. The simulation reproduces the test results well in terms of initial stiffness,
while the strength of the joint is underestimated by about 10% if compared to the test
average. Following the first damage mechanism the simulation indicates a load drop
which is followed by load increase and decrease leading to an oscillation pattern. The
force level of this oscillation agrees well with the average plateau of the test results
(stage ③). However, the amplitude of the oscillation appears to be high if compared to
the test results. It is assumed that this results from the disregard of the face to core
adhesive bond. Due to the complicated mechanisms in the contact zone, the required
computational time for this simulation exceeds 100 h in case the post failure regime shall
be included in the simulation. The point of catastrophic failure can be predicted with
computation times within the limits of the defined requirements. Regarding the visual
failure modes, the model indicates the same damage mechanisms as the physical tests
7 Virtual testing approach for sandwich panel joints
with the shear test model. The load is applied via a rigid plate which is prescribed a constant velocity compressing the joint based on a penalty contact. All implemented material models and contact definitions are identical to the L-joint shear tests.
a)
b)
Figure 122 Simulation results for corner joints, a) L-joint shear and b) L-joint bending
Figure 122 b) illustrates the simulation results as force-displacement curve and visual
failure mode. The simulation reproduces the test results well in terms of initial stiffness,
while the strength of the joint is underestimated by about 10% if compared to the test
average. Following the first damage mechanism the simulation indicates a load drop
which is followed by load increase and decrease leading to an oscillation pattern. The
force level of this oscillation agrees well with the average plateau of the test results
(stage ③). However, the amplitude of the oscillation appears to be high if compared to
the test results. It is assumed that this results from the disregard of the face to core
adhesive bond. Due to the complicated mechanisms in the contact zone, the required
computational time for this simulation exceeds 100 h in case the post failure regime shall
be included in the simulation. The point of catastrophic failure can be predicted with
computation times within the limits of the defined requirements. Regarding the visual
failure modes, the model indicates the same damage mechanisms as the physical tests