

222
5 Contraction
contract (K )
relax (K )
incr
K
cardiac
1
2
A
B
C
B’
K = K min
K = 1
t 1 t 2
skeletal
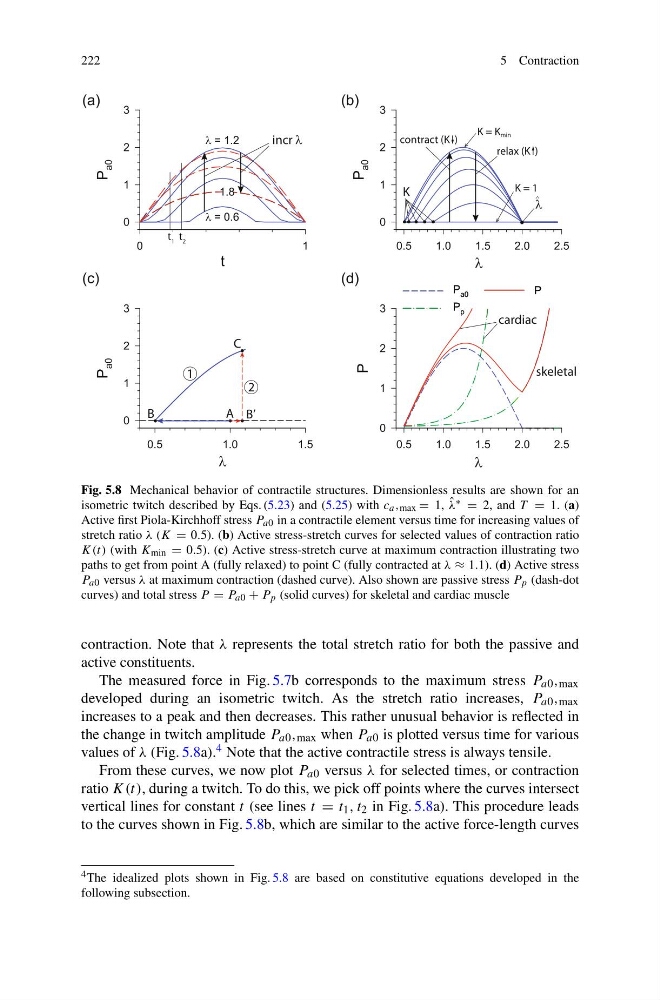
Fig. 5.8 Mechanical behavior of contractile structures. Dimensionless results are shown for an
isometric twitch described by Eqs. (5.23) and (5.25) with c a , max = 1, ˆ
λ ∗ = 2, and T = 1. (a)
Active first Piola-Kirchhoff stress P a0 in a contractile element versus time for increasing values of
stretch ratio λ (K = 0.5). (b) Active stress-stretch curves for selected values of contraction ratio
K(t) (with K min = 0.5). (c) Active stress-stretch curve at maximum contraction illustrating two
paths to get from point A (fully relaxed) to point C (fully contracted at λ ≈ 1.1). (d) Active stress
P a0 versus λ at maximum contraction (dashed curve). Also shown are passive stress P p (dash-dot
curves) and total stress P = P a0 + P p (solid curves) for skeletal and cardiac muscle
contraction. Note that λ represents the total stretch ratio for both the passive and
active constituents.
The measured force in Fig. 5.7b corresponds to the maximum stress P a0 , max
developed during an isometric twitch. As the stretch ratio increases, P a0 , max
increases to a peak and then decreases. This rather unusual behavior is reflected in
the change in twitch amplitude P a0 , max when P a0 is plotted versus time for various
values of λ (Fig. 5.8a). 4 Note that the active contractile stress is always tensile.
From these curves, we now plot P a0 versus λ for selected times, or contraction
ratio K(t), during a twitch. To do this, we pick off points where the curves intersect
vertical lines for constant t (see lines t = t 1 , t 2 in Fig. 5.8a). This procedure leads
to the curves shown in Fig. 5.8b, which are similar to the active force-length curves
4 The idealized plots shown in Fig. 5.8 are based on constitutive equations developed in the
following subsection.
5 Contraction
contract (K )
relax (K )
incr
K
cardiac
1
2
A
B
C
B’
K = K min
K = 1
t 1 t 2
skeletal
Fig. 5.8 Mechanical behavior of contractile structures. Dimensionless results are shown for an
isometric twitch described by Eqs. (5.23) and (5.25) with c a , max = 1, ˆ
λ ∗ = 2, and T = 1. (a)
Active first Piola-Kirchhoff stress P a0 in a contractile element versus time for increasing values of
stretch ratio λ (K = 0.5). (b) Active stress-stretch curves for selected values of contraction ratio
K(t) (with K min = 0.5). (c) Active stress-stretch curve at maximum contraction illustrating two
paths to get from point A (fully relaxed) to point C (fully contracted at λ ≈ 1.1). (d) Active stress
P a0 versus λ at maximum contraction (dashed curve). Also shown are passive stress P p (dash-dot
curves) and total stress P = P a0 + P p (solid curves) for skeletal and cardiac muscle
contraction. Note that λ represents the total stretch ratio for both the passive and
active constituents.
The measured force in Fig. 5.7b corresponds to the maximum stress P a0 , max
developed during an isometric twitch. As the stretch ratio increases, P a0 , max
increases to a peak and then decreases. This rather unusual behavior is reflected in
the change in twitch amplitude P a0 , max when P a0 is plotted versus time for various
values of λ (Fig. 5.8a). 4 Note that the active contractile stress is always tensile.
From these curves, we now plot P a0 versus λ for selected times, or contraction
ratio K(t), during a twitch. To do this, we pick off points where the curves intersect
vertical lines for constant t (see lines t = t 1 , t 2 in Fig. 5.8a). This procedure leads
to the curves shown in Fig. 5.8b, which are similar to the active force-length curves
4 The idealized plots shown in Fig. 5.8 are based on constitutive equations developed in the
following subsection.