

13.3 Catalysis of Pt Clusters
223
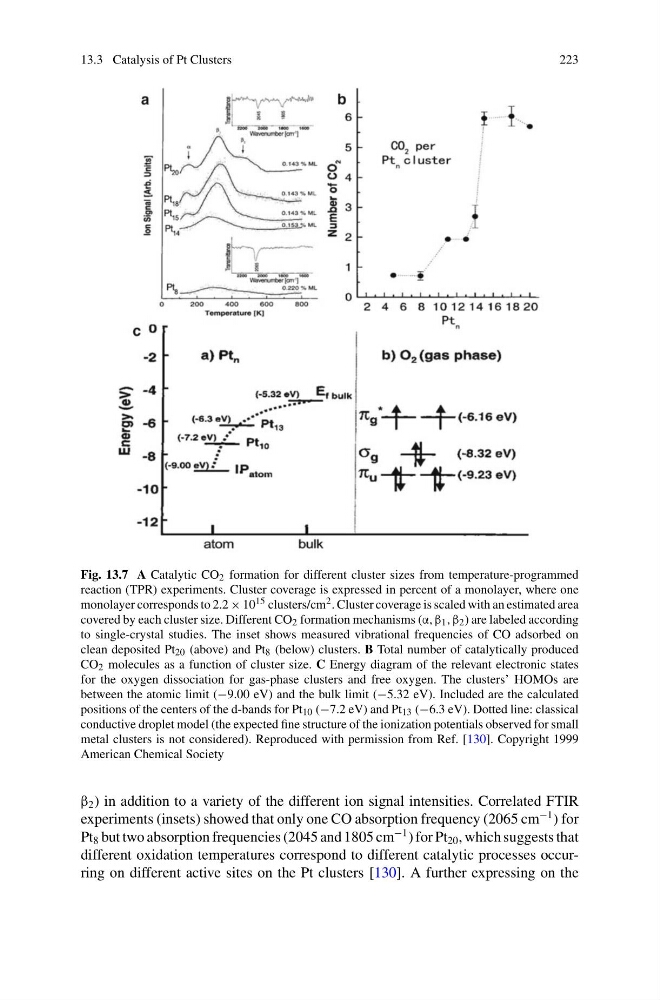
Fig. 13.7 A Catalytic CO 2 formation for different cluster sizes from temperature-programmed
reaction (TPR) experiments. Cluster coverage is expressed in percent of a monolayer, where one
monolayer corresponds to 2.2 × 10 15 clusters/cm 2 . Cluster coverage is scaled with an estimated area
covered by each cluster size. Different CO 2 formation mechanisms (α, β 1 , β 2 ) are labeled according
to single-crystal studies. The inset shows measured vibrational frequencies of CO adsorbed on
clean deposited Pt 20 (above) and Pt 8 (below) clusters. B Total number of catalytically produced
CO 2 molecules as a function of cluster size. C Energy diagram of the relevant electronic states
for the oxygen dissociation for gas-phase clusters and free oxygen. The clusters’ HOMOs are
between the atomic limit (−9.00 eV) and the bulk limit (−5.32 eV). Included are the calculated
positions of the centers of the d-bands for Pt 10 (−7.2 eV) and Pt 13 (−6.3 eV). Dotted line: classical
conductive droplet model (the expected fine structure of the ionization potentials observed for small
metal clusters is not considered). Reproduced with permission from Ref. [130]. Copyright 1999
American Chemical Society
β 2 ) in addition to a variety of the different ion signal intensities. Correlated FTIR
experiments (insets) showed that only one CO absorption frequency (2065 cm
−1 ) for
Pt 8 but two absorption frequencies (2045 and 1805 cm
−1 ) for Pt 20 , which suggests that
different oxidation temperatures correspond to different catalytic processes occurring on different active sites on the Pt clusters [130]. A further expressing on the
223
Fig. 13.7 A Catalytic CO 2 formation for different cluster sizes from temperature-programmed
reaction (TPR) experiments. Cluster coverage is expressed in percent of a monolayer, where one
monolayer corresponds to 2.2 × 10 15 clusters/cm 2 . Cluster coverage is scaled with an estimated area
covered by each cluster size. Different CO 2 formation mechanisms (α, β 1 , β 2 ) are labeled according
to single-crystal studies. The inset shows measured vibrational frequencies of CO adsorbed on
clean deposited Pt 20 (above) and Pt 8 (below) clusters. B Total number of catalytically produced
CO 2 molecules as a function of cluster size. C Energy diagram of the relevant electronic states
for the oxygen dissociation for gas-phase clusters and free oxygen. The clusters’ HOMOs are
between the atomic limit (−9.00 eV) and the bulk limit (−5.32 eV). Included are the calculated
positions of the centers of the d-bands for Pt 10 (−7.2 eV) and Pt 13 (−6.3 eV). Dotted line: classical
conductive droplet model (the expected fine structure of the ionization potentials observed for small
metal clusters is not considered). Reproduced with permission from Ref. [130]. Copyright 1999
American Chemical Society
β 2 ) in addition to a variety of the different ion signal intensities. Correlated FTIR
experiments (insets) showed that only one CO absorption frequency (2065 cm
−1 ) for
Pt 8 but two absorption frequencies (2045 and 1805 cm
−1 ) for Pt 20 , which suggests that
different oxidation temperatures correspond to different catalytic processes occurring on different active sites on the Pt clusters [130]. A further expressing on the