

rock-paper-scissor-lizard-Spock (RPSLS) game model to five mobile species [33],
although in our graph there are no suppressive interactions connecting each
species to its two next nearest neighbors. In particular, our “macroscopic”
model, Eq. (3) extended to account for five species, reveals the coexistence of
all species even at high allelopathic suppression (μ = 0.4) but small species and
toxin diffusivities. For large diffusivities species are led to extinction, as illustrated
in Fig. 8, and eventually one species dominates the entire landscape (see Fig. 9).
Again, as in the RPSLS model, the coexistence or extinction is generated
through the interaction of five distinct local spiral wave patterns. At last,
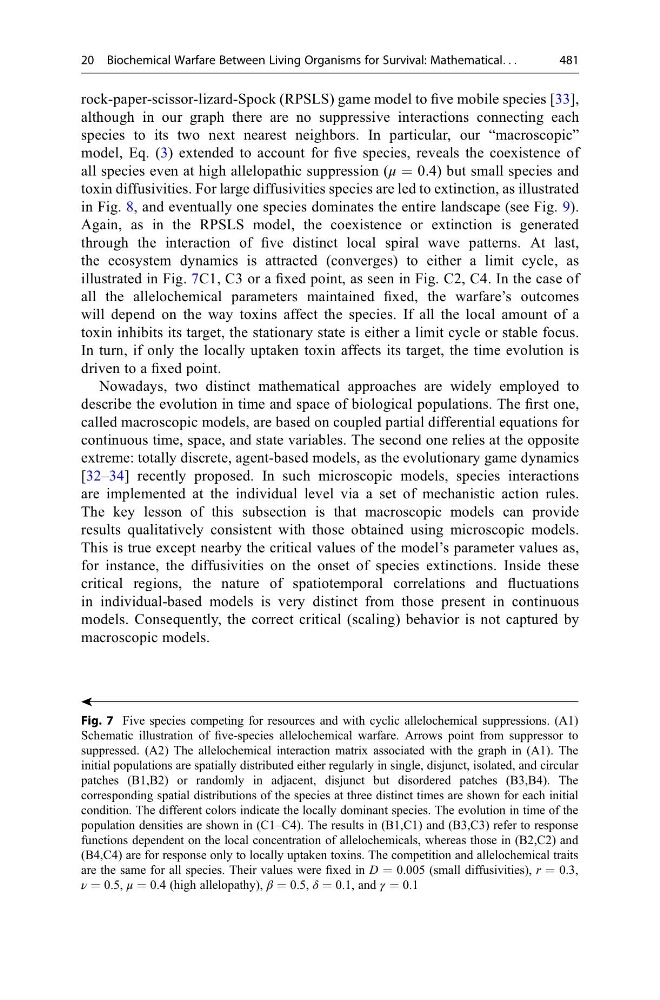
the ecosystem dynamics is attracted (converges) to either a limit cycle, as
illustrated in Fig. 7C1, C3 or a fixed point, as seen in Fig. C2, C4. In the case of
all the allelochemical parameters maintained fixed, the warfare’s outcomes
will depend on the way toxins affect the species. If all the local amount of a
toxin inhibits its target, the stationary state is either a limit cycle or stable focus.
In turn, if only the locally uptaken toxin affects its target, the time evolution is
driven to a fixed point.
Nowadays, two distinct mathematical approaches are widely employed to
describe the evolution in time and space of biological populations. The first one,
called macroscopic models, are based on coupled partial differential equations for
continuous time, space, and state variables. The second one relies at the opposite
extreme: totally discrete, agent-based models, as the evolutionary game dynamics
[32–34] recently proposed. In such microscopic models, species interactions
are implemented at the individual level via a set of mechanistic action rules.
The key lesson of this subsection is that macroscopic models can provide
results qualitatively consistent with those obtained using microscopic models.
This is true except nearby the critical values of the model’s parameter values as,
for instance, the diffusivities on the onset of species extinctions. Inside these
critical regions, the nature of spatiotemporal correlations and fluctuations
in individual-based models is very distinct from those present in continuous
models. Consequently, the correct critical (scaling) behavior is not captured by
macroscopic models.
ä
Fig. 7 Five species competing for resources and with cyclic allelochemical suppressions. (A1)
Schematic illustration of five-species allelochemical warfare. Arrows point from suppressor to
suppressed. (A2) The allelochemical interaction matrix associated with the graph in (A1). The
initial populations are spatially distributed either regularly in single, disjunct, isolated, and circular
patches (B1,B2) or randomly in adjacent, disjunct but disordered patches (B3,B4). The
corresponding spatial distributions of the species at three distinct times are shown for each initial
condition. The different colors indicate the locally dominant species. The evolution in time of the
population densities are shown in (C1–C4). The results in (B1,C1) and (B3,C3) refer to response
functions dependent on the local concentration of allelochemicals, whereas those in (B2,C2) and
(B4,C4) are for response only to locally uptaken toxins. The competition and allelochemical traits
are the same for all species. Their values were fixed in D = 0.005 (small diffusivities), r = 0.3,
ν = 0.5, μ = 0.4 (high allelopathy), β = 0.5, δ = 0.1, and γ = 0.1
20 Biochemical Warfare Between Living Organisms for Survival: Mathematical. . .
481
although in our graph there are no suppressive interactions connecting each
species to its two next nearest neighbors. In particular, our “macroscopic”
model, Eq. (3) extended to account for five species, reveals the coexistence of
all species even at high allelopathic suppression (μ = 0.4) but small species and
toxin diffusivities. For large diffusivities species are led to extinction, as illustrated
in Fig. 8, and eventually one species dominates the entire landscape (see Fig. 9).
Again, as in the RPSLS model, the coexistence or extinction is generated
through the interaction of five distinct local spiral wave patterns. At last,
the ecosystem dynamics is attracted (converges) to either a limit cycle, as
illustrated in Fig. 7C1, C3 or a fixed point, as seen in Fig. C2, C4. In the case of
all the allelochemical parameters maintained fixed, the warfare’s outcomes
will depend on the way toxins affect the species. If all the local amount of a
toxin inhibits its target, the stationary state is either a limit cycle or stable focus.
In turn, if only the locally uptaken toxin affects its target, the time evolution is
driven to a fixed point.
Nowadays, two distinct mathematical approaches are widely employed to
describe the evolution in time and space of biological populations. The first one,
called macroscopic models, are based on coupled partial differential equations for
continuous time, space, and state variables. The second one relies at the opposite
extreme: totally discrete, agent-based models, as the evolutionary game dynamics
[32–34] recently proposed. In such microscopic models, species interactions
are implemented at the individual level via a set of mechanistic action rules.
The key lesson of this subsection is that macroscopic models can provide
results qualitatively consistent with those obtained using microscopic models.
This is true except nearby the critical values of the model’s parameter values as,
for instance, the diffusivities on the onset of species extinctions. Inside these
critical regions, the nature of spatiotemporal correlations and fluctuations
in individual-based models is very distinct from those present in continuous
models. Consequently, the correct critical (scaling) behavior is not captured by
macroscopic models.
ä
Fig. 7 Five species competing for resources and with cyclic allelochemical suppressions. (A1)
Schematic illustration of five-species allelochemical warfare. Arrows point from suppressor to
suppressed. (A2) The allelochemical interaction matrix associated with the graph in (A1). The
initial populations are spatially distributed either regularly in single, disjunct, isolated, and circular
patches (B1,B2) or randomly in adjacent, disjunct but disordered patches (B3,B4). The
corresponding spatial distributions of the species at three distinct times are shown for each initial
condition. The different colors indicate the locally dominant species. The evolution in time of the
population densities are shown in (C1–C4). The results in (B1,C1) and (B3,C3) refer to response
functions dependent on the local concentration of allelochemicals, whereas those in (B2,C2) and
(B4,C4) are for response only to locally uptaken toxins. The competition and allelochemical traits
are the same for all species. Their values were fixed in D = 0.005 (small diffusivities), r = 0.3,
ν = 0.5, μ = 0.4 (high allelopathy), β = 0.5, δ = 0.1, and γ = 0.1
20 Biochemical Warfare Between Living Organisms for Survival: Mathematical. . .
481