

68
A. Choi´ nski and R. Skowron
Table 5.1 (continued)
No
Lake
Volume (million m 3 )
Area (ha)
Location (according to [4])
22
Pile
115.2
980.1
Poj. Pomorskie (Poj.
Szczecineckie)
23
Nidzkie
113.9
1 818.0
Poj. Mazurskie (Równina
Mazurska)
24
Mokre
107.3
841.0
Poj. Mazurskie (Poj.
Mr˛ agowskie)
25
Siecino
104.4
729.7
Poj. Pomorskie (Poj.
Drawskie)
26
Gołdapiwo
101.5
862.5
Poj. Mazurskie (Kraina
Wielkich Jezior Mazurskich)
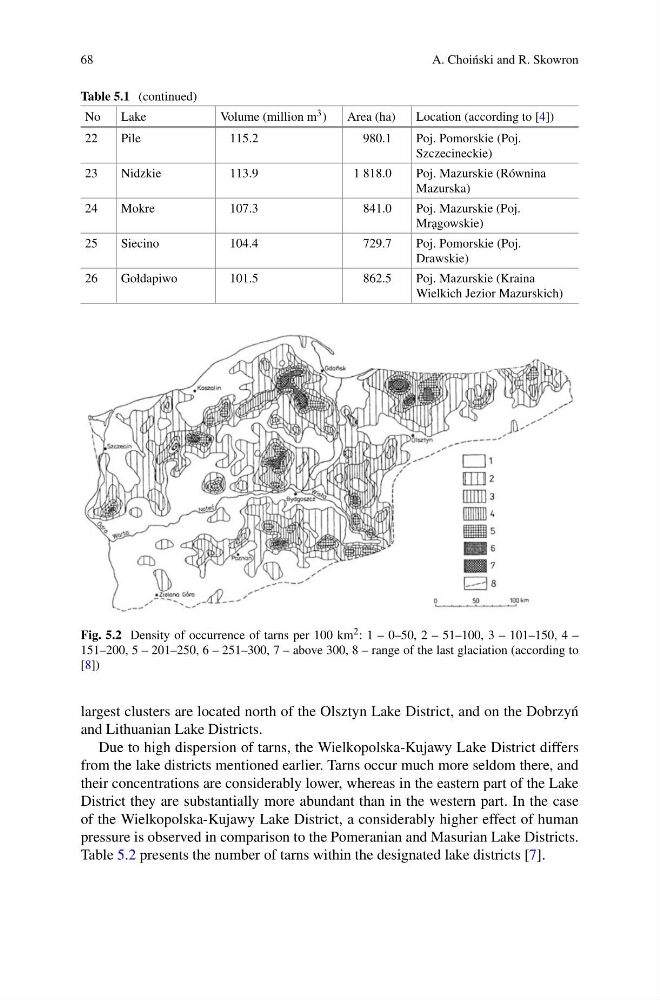
Fig. 5.2 Density of occurrence of tarns per 100 km 2 : 1 – 0–50, 2 – 51–100, 3 – 101–150, 4 –
151–200, 5 – 201–250, 6 – 251–300, 7 – above 300, 8 – range of the last glaciation (according to
[8])
largest clusters are located north of the Olsztyn Lake District, and on the Dobrzy´ n
and Lithuanian Lake Districts.
Due to high dispersion of tarns, the Wielkopolska-Kujawy Lake District differs
from the lake districts mentioned earlier. Tarns occur much more seldom there, and
their concentrations are considerably lower, whereas in the eastern part of the Lake
District they are substantially more abundant than in the western part. In the case
of the Wielkopolska-Kujawy Lake District, a considerably higher effect of human
pressure is observed in comparison to the Pomeranian and Masurian Lake Districts.
Table 5.2 presents the number of tarns within the designated lake districts [7].
A. Choi´ nski and R. Skowron
Table 5.1 (continued)
No
Lake
Volume (million m 3 )
Area (ha)
Location (according to [4])
22
Pile
115.2
980.1
Poj. Pomorskie (Poj.
Szczecineckie)
23
Nidzkie
113.9
1 818.0
Poj. Mazurskie (Równina
Mazurska)
24
Mokre
107.3
841.0
Poj. Mazurskie (Poj.
Mr˛ agowskie)
25
Siecino
104.4
729.7
Poj. Pomorskie (Poj.
Drawskie)
26
Gołdapiwo
101.5
862.5
Poj. Mazurskie (Kraina
Wielkich Jezior Mazurskich)
Fig. 5.2 Density of occurrence of tarns per 100 km 2 : 1 – 0–50, 2 – 51–100, 3 – 101–150, 4 –
151–200, 5 – 201–250, 6 – 251–300, 7 – above 300, 8 – range of the last glaciation (according to
[8])
largest clusters are located north of the Olsztyn Lake District, and on the Dobrzy´ n
and Lithuanian Lake Districts.
Due to high dispersion of tarns, the Wielkopolska-Kujawy Lake District differs
from the lake districts mentioned earlier. Tarns occur much more seldom there, and
their concentrations are considerably lower, whereas in the eastern part of the Lake
District they are substantially more abundant than in the western part. In the case
of the Wielkopolska-Kujawy Lake District, a considerably higher effect of human
pressure is observed in comparison to the Pomeranian and Masurian Lake Districts.
Table 5.2 presents the number of tarns within the designated lake districts [7].