

4 Water Resources in Poland and Their Use
51
outflow module of Polish rivers in the twentieth century was 1950 m
3 ·s
−1 , and from
the territory of Poland 1710 m
3 ·s
−1 [7]. Out of the entire volume of waters outflowing
in rivers, approximately 55% concerns the catchment of the Vistula River, and 25%
the catchment of the Oder River. The rivers of Przymorze and the Vistula Lagoon
carry respectively 9.5 and 5.9% of waters of Poland [10].
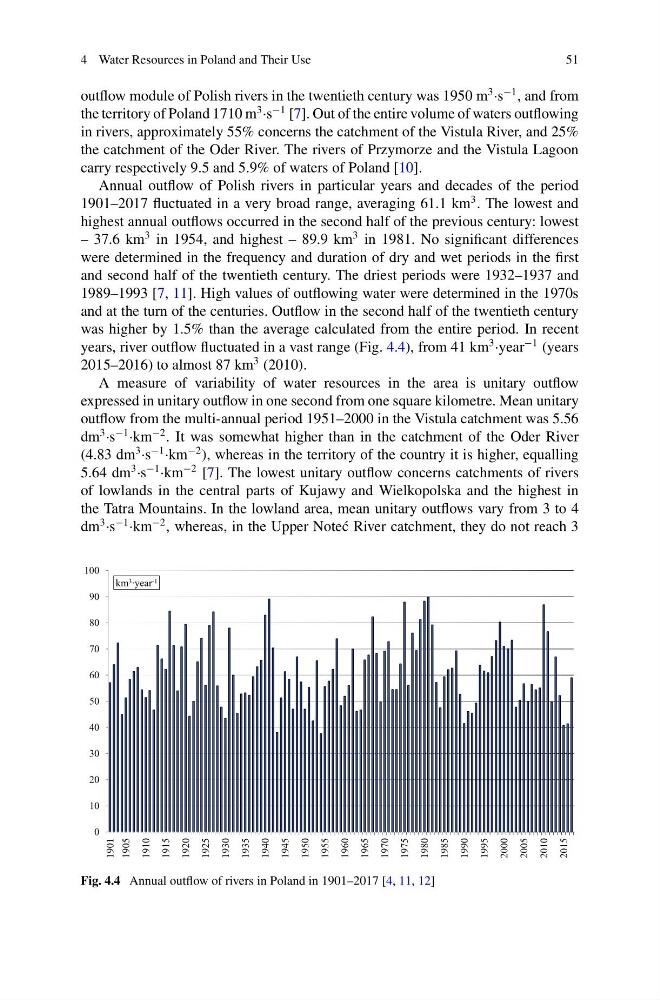
Annual outflow of Polish rivers in particular years and decades of the period
1901–2017 fluctuated in a very broad range, averaging 61.1 km
3 . The lowest and
highest annual outflows occurred in the second half of the previous century: lowest
– 37.6 km
3 in 1954, and highest – 89.9 km
3 in 1981. No significant differences
were determined in the frequency and duration of dry and wet periods in the first
and second half of the twentieth century. The driest periods were 1932–1937 and
1989–1993 [7, 11]. High values of outflowing water were determined in the 1970s
and at the turn of the centuries. Outflow in the second half of the twentieth century
was higher by 1.5% than the average calculated from the entire period. In recent
years, river outflow fluctuated in a vast range (Fig. 4.4), from 41 km
3 ·year
−1 (years
2015–2016) to almost 87 km
3 (2010).
A measure of variability of water resources in the area is unitary outflow
expressed in unitary outflow in one second from one square kilometre. Mean unitary
outflow from the multi-annual period 1951–2000 in the Vistula catchment was 5.56
dm
3 ·s
−1 ·km
−2 . It was somewhat higher than in the catchment of the Oder River
(4.83 dm
3 ·s
−1 ·km
−2 ), whereas in the territory of the country it is higher, equalling
5.64 dm
3 ·s
−1 ·km
−2 [7]. The lowest unitary outflow concerns catchments of rivers
of lowlands in the central parts of Kujawy and Wielkopolska and the highest in
the Tatra Mountains. In the lowland area, mean unitary outflows vary from 3 to 4
dm
3 ·s
−1 ·km
−2 , whereas, in the Upper Note´ c River catchment, they do not reach 3
0
10
20
30
40
50
60
70
80
90
100
1901
1905
1910
1915
1920
1925
1930
1935
1940
1945
1950
1955
1960
1965
1970
1975
1980
1985
1990
1995
2000
2005
2010
2015
km 3 ·year -1
Fig. 4.4 Annual outflow of rivers in Poland in 1901–2017 [4, 11, 12]
51
outflow module of Polish rivers in the twentieth century was 1950 m
3 ·s
−1 , and from
the territory of Poland 1710 m
3 ·s
−1 [7]. Out of the entire volume of waters outflowing
in rivers, approximately 55% concerns the catchment of the Vistula River, and 25%
the catchment of the Oder River. The rivers of Przymorze and the Vistula Lagoon
carry respectively 9.5 and 5.9% of waters of Poland [10].
Annual outflow of Polish rivers in particular years and decades of the period
1901–2017 fluctuated in a very broad range, averaging 61.1 km
3 . The lowest and
highest annual outflows occurred in the second half of the previous century: lowest
– 37.6 km
3 in 1954, and highest – 89.9 km
3 in 1981. No significant differences
were determined in the frequency and duration of dry and wet periods in the first
and second half of the twentieth century. The driest periods were 1932–1937 and
1989–1993 [7, 11]. High values of outflowing water were determined in the 1970s
and at the turn of the centuries. Outflow in the second half of the twentieth century
was higher by 1.5% than the average calculated from the entire period. In recent
years, river outflow fluctuated in a vast range (Fig. 4.4), from 41 km
3 ·year
−1 (years
2015–2016) to almost 87 km
3 (2010).
A measure of variability of water resources in the area is unitary outflow
expressed in unitary outflow in one second from one square kilometre. Mean unitary
outflow from the multi-annual period 1951–2000 in the Vistula catchment was 5.56
dm
3 ·s
−1 ·km
−2 . It was somewhat higher than in the catchment of the Oder River
(4.83 dm
3 ·s
−1 ·km
−2 ), whereas in the territory of the country it is higher, equalling
5.64 dm
3 ·s
−1 ·km
−2 [7]. The lowest unitary outflow concerns catchments of rivers
of lowlands in the central parts of Kujawy and Wielkopolska and the highest in
the Tatra Mountains. In the lowland area, mean unitary outflows vary from 3 to 4
dm
3 ·s
−1 ·km
−2 , whereas, in the Upper Note´ c River catchment, they do not reach 3
0
10
20
30
40
50
60
70
80
90
100
1901
1905
1910
1915
1920
1925
1930
1935
1940
1945
1950
1955
1960
1965
1970
1975
1980
1985
1990
1995
2000
2005
2010
2015
km 3 ·year -1
Fig. 4.4 Annual outflow of rivers in Poland in 1901–2017 [4, 11, 12]