

4 Water Resources in Poland and Their Use
47
0
5000
10000
15000
20000
25000
30000
Czechia
Poland
Belgium
Romania
Italy
Germany
Spain
UK
Denmark
Luxembourg
France
Netherlands
Switzerland
Greece
Portugal
Lithuania
Estonia
Austria
Ireland
Hungary
Bulgaria
Slovakia
Slovenia
Latvia
Sweden
Finland
Serbia
Croatia
m 3
per capita
Country resources
Total resources
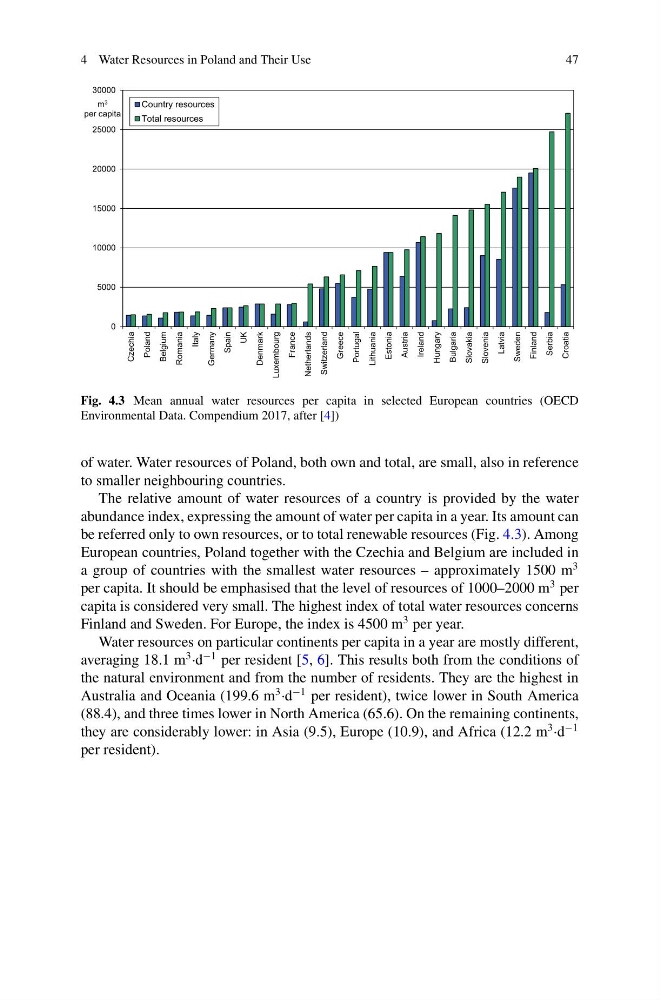
Fig. 4.3 Mean annual water resources per capita in selected European countries (OECD
Environmental Data. Compendium 2017, after [4])
of water. Water resources of Poland, both own and total, are small, also in reference
to smaller neighbouring countries.
The relative amount of water resources of a country is provided by the water
abundance index, expressing the amount of water per capita in a year. Its amount can
be referred only to own resources, or to total renewable resources (Fig. 4.3). Among
European countries, Poland together with the Czechia and Belgium are included in
a group of countries with the smallest water resources – approximately 1500 m
3
per capita. It should be emphasised that the level of resources of 1000–2000 m
3 per
capita is considered very small. The highest index of total water resources concerns
Finland and Sweden. For Europe, the index is 4500 m
3 per year.
Water resources on particular continents per capita in a year are mostly different,
averaging 18.1 m
3 ·d
−1 per resident [5, 6]. This results both from the conditions of
the natural environment and from the number of residents. They are the highest in
Australia and Oceania (199.6 m
3 ·d
−1 per resident), twice lower in South America
(88.4), and three times lower in North America (65.6). On the remaining continents,
they are considerably lower: in Asia (9.5), Europe (10.9), and Africa (12.2 m
3 ·d
−1
per resident).
47
0
5000
10000
15000
20000
25000
30000
Czechia
Poland
Belgium
Romania
Italy
Germany
Spain
UK
Denmark
Luxembourg
France
Netherlands
Switzerland
Greece
Portugal
Lithuania
Estonia
Austria
Ireland
Hungary
Bulgaria
Slovakia
Slovenia
Latvia
Sweden
Finland
Serbia
Croatia
m 3
per capita
Country resources
Total resources
Fig. 4.3 Mean annual water resources per capita in selected European countries (OECD
Environmental Data. Compendium 2017, after [4])
of water. Water resources of Poland, both own and total, are small, also in reference
to smaller neighbouring countries.
The relative amount of water resources of a country is provided by the water
abundance index, expressing the amount of water per capita in a year. Its amount can
be referred only to own resources, or to total renewable resources (Fig. 4.3). Among
European countries, Poland together with the Czechia and Belgium are included in
a group of countries with the smallest water resources – approximately 1500 m
3
per capita. It should be emphasised that the level of resources of 1000–2000 m
3 per
capita is considered very small. The highest index of total water resources concerns
Finland and Sweden. For Europe, the index is 4500 m
3 per year.
Water resources on particular continents per capita in a year are mostly different,
averaging 18.1 m
3 ·d
−1 per resident [5, 6]. This results both from the conditions of
the natural environment and from the number of residents. They are the highest in
Australia and Oceania (199.6 m
3 ·d
−1 per resident), twice lower in South America
(88.4), and three times lower in North America (65.6). On the remaining continents,
they are considerably lower: in Asia (9.5), Europe (10.9), and Africa (12.2 m
3 ·d
−1
per resident).