

412
L. Paj˛ ak et al.
working power: 220 MWel. Efficiency of thermal energy conversion into electricity @ (assuming that
the water temperature at the entrance to the cold store is 20°C higher than the temperature of the area
atmospheric):
- winter half-year 44,3%,
- summer half-year 37,1%,
- annual average 40,7%.
- expected the lowest 26,9% (by the area atmospheric temperature 34°C and power 140 MWel) #
Gross electricity production (in 2014)*:
- 753 GWh/winter half-year (average power 172 MWel),
- 622 GWh/summer half-year (average power 142 MWel),
- 1375 GWh/year (average power157 MWel).
Power of condensers
(cooling)
@ :
- winter half-year 150 MW,
- summer half-year 243 MW,
- annual average 194 MW,
- maximum 390 MW
# .
Power of boilers delivered in
fuel
@ :
- winter half-year 388 MW,
- summer half-year 464 MW,
- annual average 422 MW,
- maximum 640 MW
#
Average atmospheric temperature tatm in
Krakow area*:
- winter half-year 1,45°C,
- summer half-year 14,95°C,
- annual average 8,2°C,
- maximum 34°C
#
.
technological steam*: 535°C; 9,0 MPa
1
2
3
4
Data soursec:
* - from power plan's monitoring database,
@ - values determined by calculation on the basis of archived data from power plant,
# - data specified for extreme calculation parameters: temperature of dry thermometer 34 ° C, electric power 140 MW, stream of
water in condensers 8 m
3
/s.
M
~G
Stream of cooling water flowing through the condensers
Vch = 8 m
3
/s, cooling water temperature at the outlet from the
condensers (entry to the cold store):
- winter half-year 5,9°C,
- summer half-year 19,4°C
- annual average 12,7°C
- maximum 38,5°C
#
.
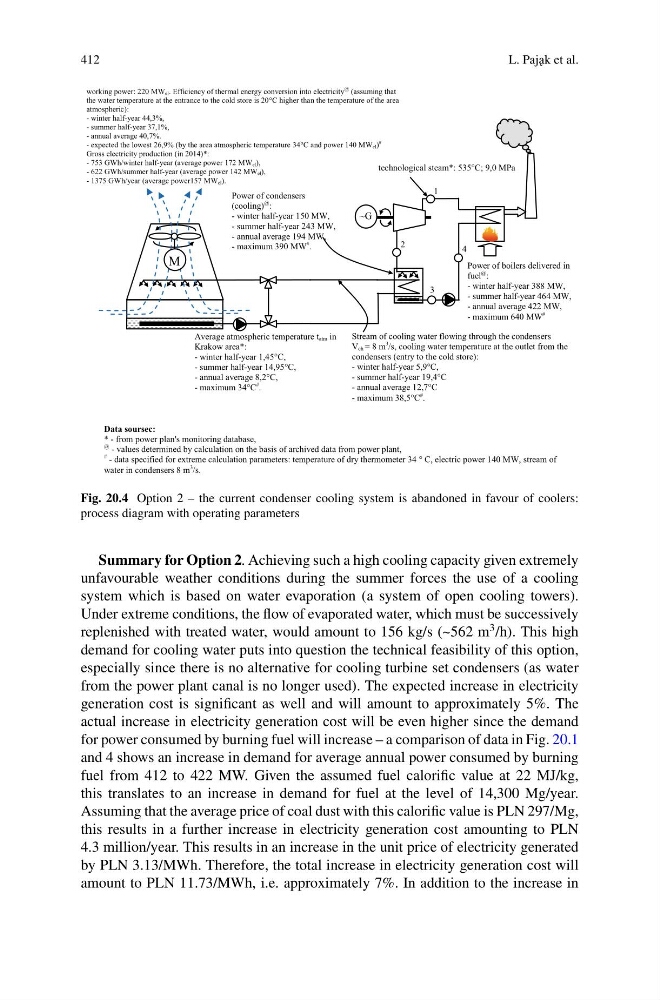
Fig. 20.4 Option 2 – the current condenser cooling system is abandoned in favour of coolers:
process diagram with operating parameters
Summary for Option 2. Achieving such a high cooling capacity given extremely
unfavourable weather conditions during the summer forces the use of a cooling
system which is based on water evaporation (a system of open cooling towers).
Under extreme conditions, the flow of evaporated water, which must be successively
replenished with treated water, would amount to 156 kg/s (~562 m
3 /h). This high
demand for cooling water puts into question the technical feasibility of this option,
especially since there is no alternative for cooling turbine set condensers (as water
from the power plant canal is no longer used). The expected increase in electricity
generation cost is significant as well and will amount to approximately 5%. The
actual increase in electricity generation cost will be even higher since the demand
for power consumed by burning fuel will increase – a comparison of data in Fig. 20.1
and 4 shows an increase in demand for average annual power consumed by burning
fuel from 412 to 422 MW. Given the assumed fuel calorific value at 22 MJ/kg,
this translates to an increase in demand for fuel at the level of 14,300 Mg/year.
Assuming that the average price of coal dust with this calorific value is PLN 297/Mg,
this results in a further increase in electricity generation cost amounting to PLN
4.3 million/year. This results in an increase in the unit price of electricity generated
by PLN 3.13/MWh. Therefore, the total increase in electricity generation cost will
amount to PLN 11.73/MWh, i.e. approximately 7%. In addition to the increase in
L. Paj˛ ak et al.
working power: 220 MWel. Efficiency of thermal energy conversion into electricity @ (assuming that
the water temperature at the entrance to the cold store is 20°C higher than the temperature of the area
atmospheric):
- winter half-year 44,3%,
- summer half-year 37,1%,
- annual average 40,7%.
- expected the lowest 26,9% (by the area atmospheric temperature 34°C and power 140 MWel) #
Gross electricity production (in 2014)*:
- 753 GWh/winter half-year (average power 172 MWel),
- 622 GWh/summer half-year (average power 142 MWel),
- 1375 GWh/year (average power157 MWel).
Power of condensers
(cooling)
@ :
- winter half-year 150 MW,
- summer half-year 243 MW,
- annual average 194 MW,
- maximum 390 MW
# .
Power of boilers delivered in
fuel
@ :
- winter half-year 388 MW,
- summer half-year 464 MW,
- annual average 422 MW,
- maximum 640 MW
#
Average atmospheric temperature tatm in
Krakow area*:
- winter half-year 1,45°C,
- summer half-year 14,95°C,
- annual average 8,2°C,
- maximum 34°C
#
.
technological steam*: 535°C; 9,0 MPa
1
2
3
4
Data soursec:
* - from power plan's monitoring database,
@ - values determined by calculation on the basis of archived data from power plant,
# - data specified for extreme calculation parameters: temperature of dry thermometer 34 ° C, electric power 140 MW, stream of
water in condensers 8 m
3
/s.
M
~G
Stream of cooling water flowing through the condensers
Vch = 8 m
3
/s, cooling water temperature at the outlet from the
condensers (entry to the cold store):
- winter half-year 5,9°C,
- summer half-year 19,4°C
- annual average 12,7°C
- maximum 38,5°C
#
.
Fig. 20.4 Option 2 – the current condenser cooling system is abandoned in favour of coolers:
process diagram with operating parameters
Summary for Option 2. Achieving such a high cooling capacity given extremely
unfavourable weather conditions during the summer forces the use of a cooling
system which is based on water evaporation (a system of open cooling towers).
Under extreme conditions, the flow of evaporated water, which must be successively
replenished with treated water, would amount to 156 kg/s (~562 m
3 /h). This high
demand for cooling water puts into question the technical feasibility of this option,
especially since there is no alternative for cooling turbine set condensers (as water
from the power plant canal is no longer used). The expected increase in electricity
generation cost is significant as well and will amount to approximately 5%. The
actual increase in electricity generation cost will be even higher since the demand
for power consumed by burning fuel will increase – a comparison of data in Fig. 20.1
and 4 shows an increase in demand for average annual power consumed by burning
fuel from 412 to 422 MW. Given the assumed fuel calorific value at 22 MJ/kg,
this translates to an increase in demand for fuel at the level of 14,300 Mg/year.
Assuming that the average price of coal dust with this calorific value is PLN 297/Mg,
this results in a further increase in electricity generation cost amounting to PLN
4.3 million/year. This results in an increase in the unit price of electricity generated
by PLN 3.13/MWh. Therefore, the total increase in electricity generation cost will
amount to PLN 11.73/MWh, i.e. approximately 7%. In addition to the increase in