

14 Flood Potential of Polish Rivers
271
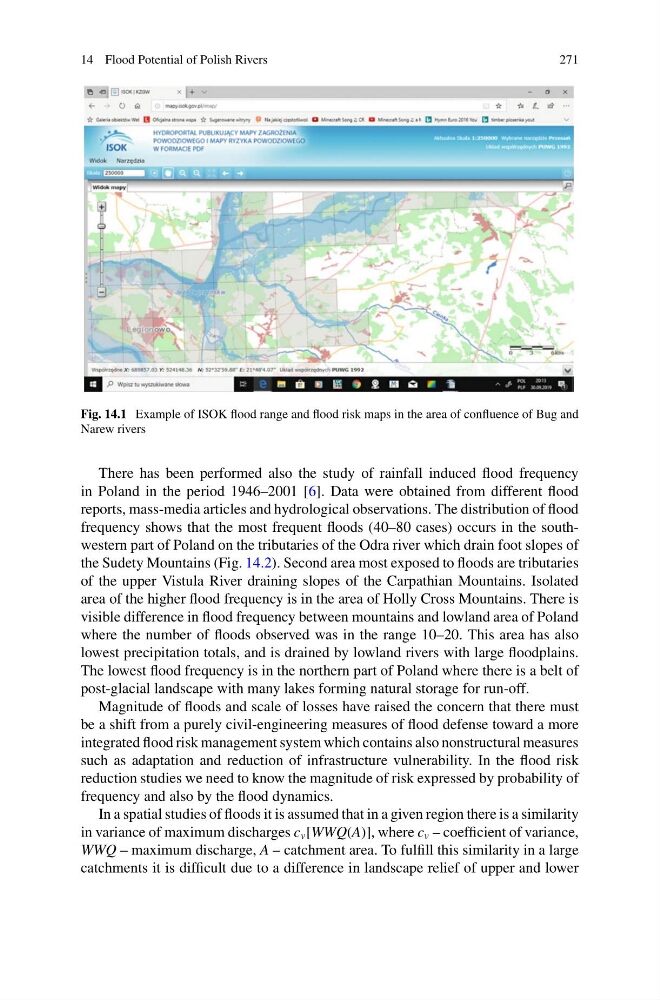
Fig. 14.1 Example of ISOK flood range and flood risk maps in the area of confluence of Bug and
Narew rivers
There has been performed also the study of rainfall induced flood frequency
in Poland in the period 1946–2001 [6]. Data were obtained from different flood
reports, mass-media articles and hydrological observations. The distribution of flood
frequency shows that the most frequent floods (40–80 cases) occurs in the southwestern part of Poland on the tributaries of the Odra river which drain foot slopes of
the Sudety Mountains (Fig. 14.2). Second area most exposed to floods are tributaries
of the upper Vistula River draining slopes of the Carpathian Mountains. Isolated
area of the higher flood frequency is in the area of Holly Cross Mountains. There is
visible difference in flood frequency between mountains and lowland area of Poland
where the number of floods observed was in the range 10–20. This area has also
lowest precipitation totals, and is drained by lowland rivers with large floodplains.
The lowest flood frequency is in the northern part of Poland where there is a belt of
post-glacial landscape with many lakes forming natural storage for run-off.
Magnitude of floods and scale of losses have raised the concern that there must
be a shift from a purely civil-engineering measures of flood defense toward a more
integrated flood risk management system which contains also nonstructural measures
such as adaptation and reduction of infrastructure vulnerability. In the flood risk
reduction studies we need to know the magnitude of risk expressed by probability of
frequency and also by the flood dynamics.
In a spatial studies of floods it is assumed that in a given region there is a similarity
in variance of maximum discharges c v [WWQ(A)], where c v – coefficient of variance,
WWQ – maximum discharge, A – catchment area. To fulfill this similarity in a large
catchments it is difficult due to a difference in landscape relief of upper and lower
271
Fig. 14.1 Example of ISOK flood range and flood risk maps in the area of confluence of Bug and
Narew rivers
There has been performed also the study of rainfall induced flood frequency
in Poland in the period 1946–2001 [6]. Data were obtained from different flood
reports, mass-media articles and hydrological observations. The distribution of flood
frequency shows that the most frequent floods (40–80 cases) occurs in the southwestern part of Poland on the tributaries of the Odra river which drain foot slopes of
the Sudety Mountains (Fig. 14.2). Second area most exposed to floods are tributaries
of the upper Vistula River draining slopes of the Carpathian Mountains. Isolated
area of the higher flood frequency is in the area of Holly Cross Mountains. There is
visible difference in flood frequency between mountains and lowland area of Poland
where the number of floods observed was in the range 10–20. This area has also
lowest precipitation totals, and is drained by lowland rivers with large floodplains.
The lowest flood frequency is in the northern part of Poland where there is a belt of
post-glacial landscape with many lakes forming natural storage for run-off.
Magnitude of floods and scale of losses have raised the concern that there must
be a shift from a purely civil-engineering measures of flood defense toward a more
integrated flood risk management system which contains also nonstructural measures
such as adaptation and reduction of infrastructure vulnerability. In the flood risk
reduction studies we need to know the magnitude of risk expressed by probability of
frequency and also by the flood dynamics.
In a spatial studies of floods it is assumed that in a given region there is a similarity
in variance of maximum discharges c v [WWQ(A)], where c v – coefficient of variance,
WWQ – maximum discharge, A – catchment area. To fulfill this similarity in a large
catchments it is difficult due to a difference in landscape relief of upper and lower