

12 Dynamics, Range, and Severity of Hydrological …
241
severity index, in which the degree of drainage of catchment water resources available
during low flow periods exceeded 30% usually constituted a core of a few-year long
drought periods, e.g., 1990–1994, 2002–2006. Mild hydrological droughts (S D <
20%) occurred in 1986, 1998–2001 and 2009–2011. They were usually characterized
by small range and lower than the average annual number of days with hydrological
drought.
The index of severe drought contribution was a source of many interesting observations (Fig. 12.5). Its values in the multiannual period of investigation varied from
0.15 to 18.95% and were obviously the highest in the years with severe hydrological
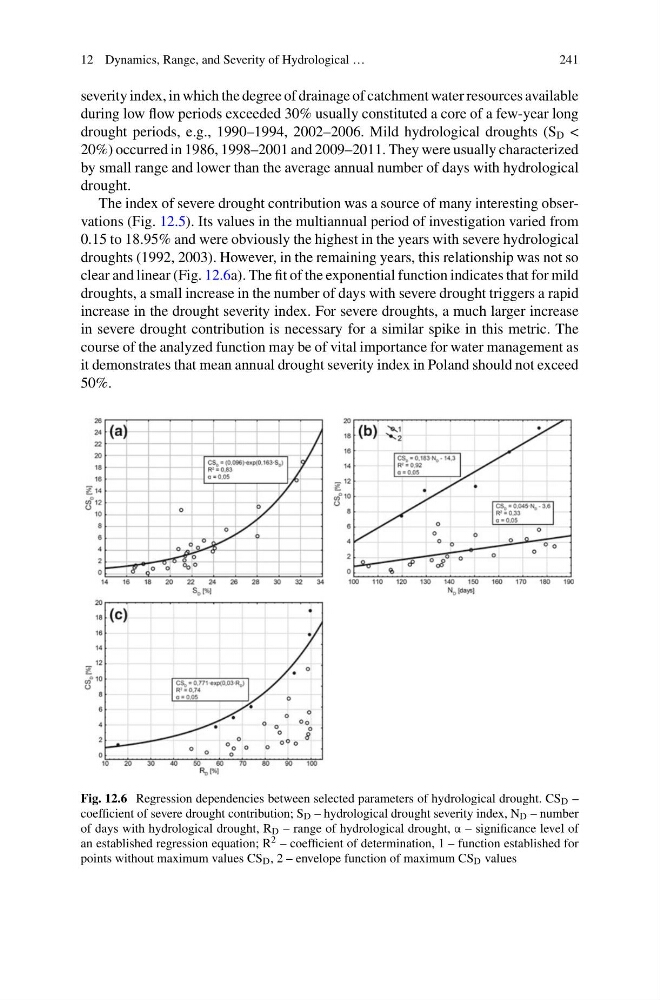
droughts (1992, 2003). However, in the remaining years, this relationship was not so
clear and linear (Fig. 12.6a). The fit of the exponential function indicates that for mild
droughts, a small increase in the number of days with severe drought triggers a rapid
increase in the drought severity index. For severe droughts, a much larger increase
in severe drought contribution is necessary for a similar spike in this metric. The
course of the analyzed function may be of vital importance for water management as
it demonstrates that mean annual drought severity index in Poland should not exceed
50%.
Fig. 12.6 Regression dependencies between selected parameters of hydrological drought. CS D –
coefficient of severe drought contribution; S D – hydrological drought severity index, N D – number
of days with hydrological drought, R D – range of hydrological drought, α – significance level of
an established regression equation; R 2 – coefficient of determination, 1 – function established for
points without maximum values CS D , 2 – envelope function of maximum CS D values
241
severity index, in which the degree of drainage of catchment water resources available
during low flow periods exceeded 30% usually constituted a core of a few-year long
drought periods, e.g., 1990–1994, 2002–2006. Mild hydrological droughts (S D <
20%) occurred in 1986, 1998–2001 and 2009–2011. They were usually characterized
by small range and lower than the average annual number of days with hydrological
drought.
The index of severe drought contribution was a source of many interesting observations (Fig. 12.5). Its values in the multiannual period of investigation varied from
0.15 to 18.95% and were obviously the highest in the years with severe hydrological
droughts (1992, 2003). However, in the remaining years, this relationship was not so
clear and linear (Fig. 12.6a). The fit of the exponential function indicates that for mild
droughts, a small increase in the number of days with severe drought triggers a rapid
increase in the drought severity index. For severe droughts, a much larger increase
in severe drought contribution is necessary for a similar spike in this metric. The
course of the analyzed function may be of vital importance for water management as
it demonstrates that mean annual drought severity index in Poland should not exceed
50%.
Fig. 12.6 Regression dependencies between selected parameters of hydrological drought. CS D –
coefficient of severe drought contribution; S D – hydrological drought severity index, N D – number
of days with hydrological drought, R D – range of hydrological drought, α – significance level of
an established regression equation; R 2 – coefficient of determination, 1 – function established for
points without maximum values CS D , 2 – envelope function of maximum CS D values