

236
E. Tomaszewski and M. Kozek
12.3 Spatial Distribution of Hydrological Drought
Estimators
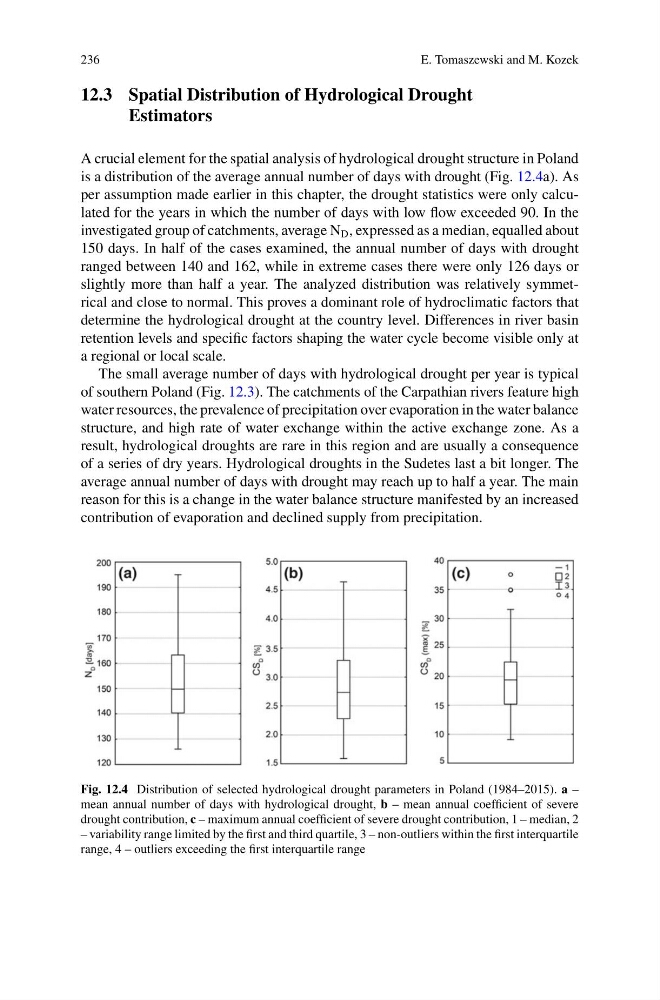
A crucial element for the spatial analysis of hydrological drought structure in Poland
is a distribution of the average annual number of days with drought (Fig. 12.4a). As
per assumption made earlier in this chapter, the drought statistics were only calculated for the years in which the number of days with low flow exceeded 90. In the
investigated group of catchments, average N D , expressed as a median, equalled about
150 days. In half of the cases examined, the annual number of days with drought
ranged between 140 and 162, while in extreme cases there were only 126 days or
slightly more than half a year. The analyzed distribution was relatively symmetrical and close to normal. This proves a dominant role of hydroclimatic factors that
determine the hydrological drought at the country level. Differences in river basin
retention levels and specific factors shaping the water cycle become visible only at
a regional or local scale.
The small average number of days with hydrological drought per year is typical
of southern Poland (Fig. 12.3). The catchments of the Carpathian rivers feature high
water resources, the prevalence of precipitation over evaporation in the water balance
structure, and high rate of water exchange within the active exchange zone. As a
result, hydrological droughts are rare in this region and are usually a consequence
of a series of dry years. Hydrological droughts in the Sudetes last a bit longer. The
average annual number of days with drought may reach up to half a year. The main
reason for this is a change in the water balance structure manifested by an increased
contribution of evaporation and declined supply from precipitation.
Fig. 12.4 Distribution of selected hydrological drought parameters in Poland (1984–2015). a –
mean annual number of days with hydrological drought, b – mean annual coefficient of severe
drought contribution, c – maximum annual coefficient of severe drought contribution, 1 – median, 2
– variability range limited by the first and third quartile, 3 – non-outliers within the first interquartile
range, 4 – outliers exceeding the first interquartile range
E. Tomaszewski and M. Kozek
12.3 Spatial Distribution of Hydrological Drought
Estimators
A crucial element for the spatial analysis of hydrological drought structure in Poland
is a distribution of the average annual number of days with drought (Fig. 12.4a). As
per assumption made earlier in this chapter, the drought statistics were only calculated for the years in which the number of days with low flow exceeded 90. In the
investigated group of catchments, average N D , expressed as a median, equalled about
150 days. In half of the cases examined, the annual number of days with drought
ranged between 140 and 162, while in extreme cases there were only 126 days or
slightly more than half a year. The analyzed distribution was relatively symmetrical and close to normal. This proves a dominant role of hydroclimatic factors that
determine the hydrological drought at the country level. Differences in river basin
retention levels and specific factors shaping the water cycle become visible only at
a regional or local scale.
The small average number of days with hydrological drought per year is typical
of southern Poland (Fig. 12.3). The catchments of the Carpathian rivers feature high
water resources, the prevalence of precipitation over evaporation in the water balance
structure, and high rate of water exchange within the active exchange zone. As a
result, hydrological droughts are rare in this region and are usually a consequence
of a series of dry years. Hydrological droughts in the Sudetes last a bit longer. The
average annual number of days with drought may reach up to half a year. The main
reason for this is a change in the water balance structure manifested by an increased
contribution of evaporation and declined supply from precipitation.
Fig. 12.4 Distribution of selected hydrological drought parameters in Poland (1984–2015). a –
mean annual number of days with hydrological drought, b – mean annual coefficient of severe
drought contribution, c – maximum annual coefficient of severe drought contribution, 1 – median, 2
– variability range limited by the first and third quartile, 3 – non-outliers within the first interquartile
range, 4 – outliers exceeding the first interquartile range