

12 Dynamics, Range, and Severity of Hydrological …
233
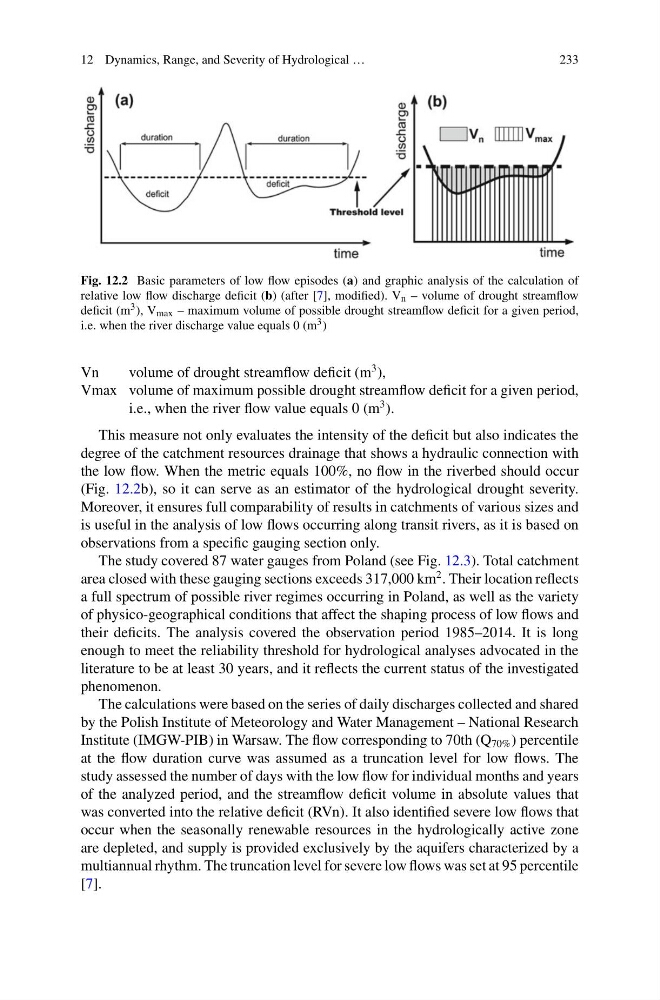
Fig. 12.2 Basic parameters of low flow episodes (a) and graphic analysis of the calculation of
relative low flow discharge deficit (b) (after [7], modified). V n – volume of drought streamflow
deficit (m 3 ), V max – maximum volume of possible drought streamflow deficit for a given period,
i.e. when the river discharge value equals 0 (m 3 )
Vn
volume of drought streamflow deficit (m
3 ),
Vmax volume of maximum possible drought streamflow deficit for a given period,
i.e., when the river flow value equals 0 (m
3 ).
This measure not only evaluates the intensity of the deficit but also indicates the
degree of the catchment resources drainage that shows a hydraulic connection with
the low flow. When the metric equals 100%, no flow in the riverbed should occur
(Fig. 12.2b), so it can serve as an estimator of the hydrological drought severity.
Moreover, it ensures full comparability of results in catchments of various sizes and
is useful in the analysis of low flows occurring along transit rivers, as it is based on
observations from a specific gauging section only.
The study covered 87 water gauges from Poland (see Fig. 12.3). Total catchment
area closed with these gauging sections exceeds 317,000 km
2 . Their location reflects
a full spectrum of possible river regimes occurring in Poland, as well as the variety
of physico-geographical conditions that affect the shaping process of low flows and
their deficits. The analysis covered the observation period 1985–2014. It is long
enough to meet the reliability threshold for hydrological analyses advocated in the
literature to be at least 30 years, and it reflects the current status of the investigated
phenomenon.
The calculations were based on the series of daily discharges collected and shared
by the Polish Institute of Meteorology and Water Management – National Research
Institute (IMGW-PIB) in Warsaw. The flow corresponding to 70th (Q 70% ) percentile
at the flow duration curve was assumed as a truncation level for low flows. The
study assessed the number of days with the low flow for individual months and years
of the analyzed period, and the streamflow deficit volume in absolute values that
was converted into the relative deficit (RVn). It also identified severe low flows that
occur when the seasonally renewable resources in the hydrologically active zone
are depleted, and supply is provided exclusively by the aquifers characterized by a
multiannual rhythm. The truncation level for severe low flows was set at 95 percentile
[7].
233
Fig. 12.2 Basic parameters of low flow episodes (a) and graphic analysis of the calculation of
relative low flow discharge deficit (b) (after [7], modified). V n – volume of drought streamflow
deficit (m 3 ), V max – maximum volume of possible drought streamflow deficit for a given period,
i.e. when the river discharge value equals 0 (m 3 )
Vn
volume of drought streamflow deficit (m
3 ),
Vmax volume of maximum possible drought streamflow deficit for a given period,
i.e., when the river flow value equals 0 (m
3 ).
This measure not only evaluates the intensity of the deficit but also indicates the
degree of the catchment resources drainage that shows a hydraulic connection with
the low flow. When the metric equals 100%, no flow in the riverbed should occur
(Fig. 12.2b), so it can serve as an estimator of the hydrological drought severity.
Moreover, it ensures full comparability of results in catchments of various sizes and
is useful in the analysis of low flows occurring along transit rivers, as it is based on
observations from a specific gauging section only.
The study covered 87 water gauges from Poland (see Fig. 12.3). Total catchment
area closed with these gauging sections exceeds 317,000 km
2 . Their location reflects
a full spectrum of possible river regimes occurring in Poland, as well as the variety
of physico-geographical conditions that affect the shaping process of low flows and
their deficits. The analysis covered the observation period 1985–2014. It is long
enough to meet the reliability threshold for hydrological analyses advocated in the
literature to be at least 30 years, and it reflects the current status of the investigated
phenomenon.
The calculations were based on the series of daily discharges collected and shared
by the Polish Institute of Meteorology and Water Management – National Research
Institute (IMGW-PIB) in Warsaw. The flow corresponding to 70th (Q 70% ) percentile
at the flow duration curve was assumed as a truncation level for low flows. The
study assessed the number of days with the low flow for individual months and years
of the analyzed period, and the streamflow deficit volume in absolute values that
was converted into the relative deficit (RVn). It also identified severe low flows that
occur when the seasonally renewable resources in the hydrologically active zone
are depleted, and supply is provided exclusively by the aquifers characterized by a
multiannual rhythm. The truncation level for severe low flows was set at 95 percentile
[7].