

220
E. Tomaszewski and K. Kubiak-Wójcicka
low-low episodes. Estimated determination coefficients varied between 0.022 and
0.049 which means that from 2% to 5% of observed multiannual low-flow duration
variability might be explained by systematic linear tendency. Therefore presented
results should be interpreted very carefully. Positive trends of low-flow duration
occurred only in lowland catchments where seasonally precipitation shortage and
agricultural drought occurs (Fig. 11.7). Restricted water resources, adverse structure
of water balance, and tendency to lengthening of low-flow periods should be taken
into consideration in further plans of water management development in this part
of the country. There were also statistically significant tendencies in inter-low-flow
spacing (Fig. 11.10b). All of them have positive direction and appeared in the north
and east part of Poland (Fig. 11.7). It means that low-flow occurrence frequency in
these catchments systematically decreases.
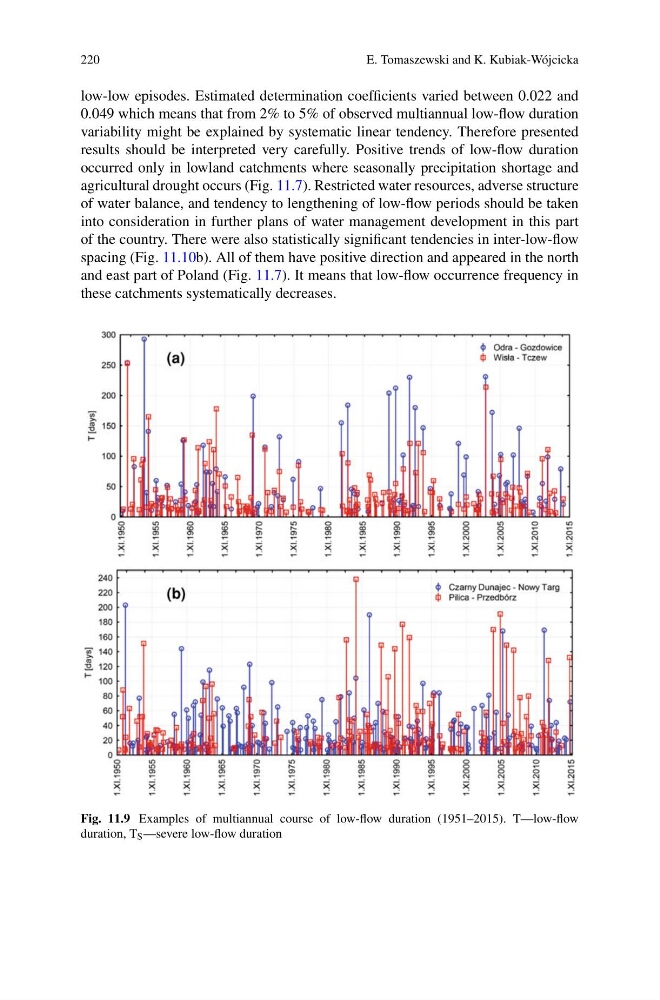
Fig. 11.9 Examples of multiannual course of low-flow duration (1951–2015). T—low-flow
duration, T S —severe low-flow duration
E. Tomaszewski and K. Kubiak-Wójcicka
low-low episodes. Estimated determination coefficients varied between 0.022 and
0.049 which means that from 2% to 5% of observed multiannual low-flow duration
variability might be explained by systematic linear tendency. Therefore presented
results should be interpreted very carefully. Positive trends of low-flow duration
occurred only in lowland catchments where seasonally precipitation shortage and
agricultural drought occurs (Fig. 11.7). Restricted water resources, adverse structure
of water balance, and tendency to lengthening of low-flow periods should be taken
into consideration in further plans of water management development in this part
of the country. There were also statistically significant tendencies in inter-low-flow
spacing (Fig. 11.10b). All of them have positive direction and appeared in the north
and east part of Poland (Fig. 11.7). It means that low-flow occurrence frequency in
these catchments systematically decreases.
Fig. 11.9 Examples of multiannual course of low-flow duration (1951–2015). T—low-flow
duration, T S —severe low-flow duration