

532
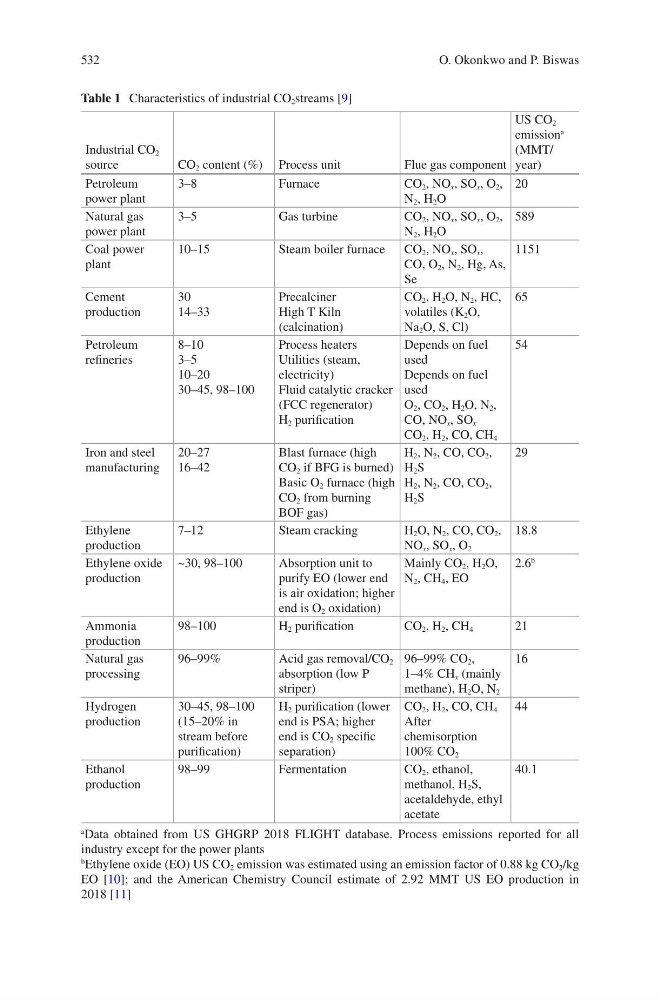
Table 1 Characteristics of industrial CO 2 streams [9]
Industrial CO 2
source
CO 2 content (%) Process unit
Flue gas component
US CO 2
emission
a
(MMT/
year)
Petroleum
power plant
3–8
Furnace
CO 2 , NO x , SO x , O 2 ,
N 2 , H 2 O
20
Natural gas
power plant
3–5
Gas turbine
CO 2 , NO x , SO x , O 2 ,
N 2 , H 2 O
589
Coal power
plant
10–15
Steam boiler furnace
CO 2 , NO x , SO x ,
CO, O 2 , N 2 , Hg, As,
Se
1151
Cement
production
30
14–33
Precalciner
High T Kiln
(calcination)
CO 2 , H 2 O, N 2 , HC,
volatiles (K 2 O,
Na 2 O, S, Cl)
65
Petroleum
refineries
8–10
3–5
10–20
30–45, 98–100
Process heaters
Utilities (steam,
electricity)
Fluid catalytic cracker
(FCC regenerator)
H 2 purification
Depends on fuel
used
Depends on fuel
used
O 2 , CO 2 , H 2 O, N 2 ,
CO, NO x , SO x
CO 2 , H 2 , CO, CH 4
54
Iron and steel
manufacturing
20–27
16–42
Blast furnace (high
CO 2 if BFG is burned)
Basic O 2 furnace (high
CO 2 from burning
BOF gas)
H 2 , N 2 , CO, CO 2 ,
H 2 S
H 2 , N 2 , CO, CO 2 ,
H 2 S
29
Ethylene
production
7–12
Steam cracking
H 2 O, N 2 , CO, CO 2 ,
NO x , SO x , O 2
18.8
Ethylene oxide
production
~30, 98–100
Absorption unit to
purify EO (lower end
is air oxidation; higher
end is O 2 oxidation)
Mainly CO 2 , H 2 O,
N 2 , CH 4 , EO
2.6
b
Ammonia
production
98–100
H 2 purification
CO 2 , H 2 , CH 4
21
Natural gas
processing
96–99%
Acid gas removal/CO 2
absorption (low P
striper)
96–99% CO 2 ,
1–4% CH x (mainly
methane), H 2 O, N 2
16
Hydrogen
production
30–45, 98–100
(15–20% in
stream before
purification)
H 2 purification (lower
end is PSA; higher
end is CO 2 specific
separation)
CO 2 , H 2 , CO, CH 4
After
chemisorption
100% CO 2
44
Ethanol
production
98–99
Fermentation
CO 2 , ethanol,
methanol, H 2 S,
acetaldehyde, ethyl
acetate
40.1
a
Data obtained from US GHGRP 2018 FLIGHT database. Process emissions reported for all
industry except for the power plants
b
Ethylene oxide (EO) US CO 2 emission was estimated using an emission factor of 0.88 kg CO 2 /kg
EO [10]; and the American Chemistry Council estimate of 2.92 MMT US EO production in
2018 [11]
O. Okonkwo and P. Biswas
Table 1 Characteristics of industrial CO 2 streams [9]
Industrial CO 2
source
CO 2 content (%) Process unit
Flue gas component
US CO 2
emission
a
(MMT/
year)
Petroleum
power plant
3–8
Furnace
CO 2 , NO x , SO x , O 2 ,
N 2 , H 2 O
20
Natural gas
power plant
3–5
Gas turbine
CO 2 , NO x , SO x , O 2 ,
N 2 , H 2 O
589
Coal power
plant
10–15
Steam boiler furnace
CO 2 , NO x , SO x ,
CO, O 2 , N 2 , Hg, As,
Se
1151
Cement
production
30
14–33
Precalciner
High T Kiln
(calcination)
CO 2 , H 2 O, N 2 , HC,
volatiles (K 2 O,
Na 2 O, S, Cl)
65
Petroleum
refineries
8–10
3–5
10–20
30–45, 98–100
Process heaters
Utilities (steam,
electricity)
Fluid catalytic cracker
(FCC regenerator)
H 2 purification
Depends on fuel
used
Depends on fuel
used
O 2 , CO 2 , H 2 O, N 2 ,
CO, NO x , SO x
CO 2 , H 2 , CO, CH 4
54
Iron and steel
manufacturing
20–27
16–42
Blast furnace (high
CO 2 if BFG is burned)
Basic O 2 furnace (high
CO 2 from burning
BOF gas)
H 2 , N 2 , CO, CO 2 ,
H 2 S
H 2 , N 2 , CO, CO 2 ,
H 2 S
29
Ethylene
production
7–12
Steam cracking
H 2 O, N 2 , CO, CO 2 ,
NO x , SO x , O 2
18.8
Ethylene oxide
production
~30, 98–100
Absorption unit to
purify EO (lower end
is air oxidation; higher
end is O 2 oxidation)
Mainly CO 2 , H 2 O,
N 2 , CH 4 , EO
2.6
b
Ammonia
production
98–100
H 2 purification
CO 2 , H 2 , CH 4
21
Natural gas
processing
96–99%
Acid gas removal/CO 2
absorption (low P
striper)
96–99% CO 2 ,
1–4% CH x (mainly
methane), H 2 O, N 2
16
Hydrogen
production
30–45, 98–100
(15–20% in
stream before
purification)
H 2 purification (lower
end is PSA; higher
end is CO 2 specific
separation)
CO 2 , H 2 , CO, CH 4
After
chemisorption
100% CO 2
44
Ethanol
production
98–99
Fermentation
CO 2 , ethanol,
methanol, H 2 S,
acetaldehyde, ethyl
acetate
40.1
a
Data obtained from US GHGRP 2018 FLIGHT database. Process emissions reported for all
industry except for the power plants
b
Ethylene oxide (EO) US CO 2 emission was estimated using an emission factor of 0.88 kg CO 2 /kg
EO [10]; and the American Chemistry Council estimate of 2.92 MMT US EO production in
2018 [11]
O. Okonkwo and P. Biswas