

442
Future work will investigate flow and heat effects in systems involving multiple
microreactors, with the aim of identifying the best overall configuration to number
up the microreactors into a standalone FT unit.
Q
m
m
m
=
-
max
m in
max
(13)
DT
T T
T
E
RT
max
w
w
A
W
=
-
(14)
3 Catalysts Development for Fischer-Tropsch Synthesis
in a Microreactor
3.1 Experimental Setup and Approach
Experiments for FT synthesis are performed in an in-house custom set up with
LabVIEW automation and accurate control over a wide range of operating conditions. Figure 9 shows the experimental setup at North Carolina Agricultural and
Technical State University. The flow rate of the reactants (hydrogen and carbon
monoxide) was monitored and controlled using Cole Palmer mass flow controllers
with a range of 0.01–1 sccm. The carrier gas used in this process was nitrogen,
which was controlled using an Aalborg mass flow controller (maximum 10 sccm).
The upstream and downstream pressures are monitored using Cole-Parmer digital
pressure gauges and are fed to the LabVIEW system to control the reaction pressure
using a solenoid valve. The products are analyzed by an online GCMS from Agilent
Technologies.
The catalyst coating method is different depending on the reactor type. This will
be discussed in the catalyst development in later sections. Before experimentation,
the coated microreactors are reduced ex-situ under the flow of 10% H 2. To compensate reduction losses while transferring to the reactor line, the reactors are assembled into the reactor block and then again reduced in-situ at 350 °C for 6 h. The FT
reactions were performed after the reduction of catalyst, the catalyst performance
like selectivity, activity, kinetics, and stability was evaluated by changing operating
conditions like temperatures, gas hour space velocities, etc.
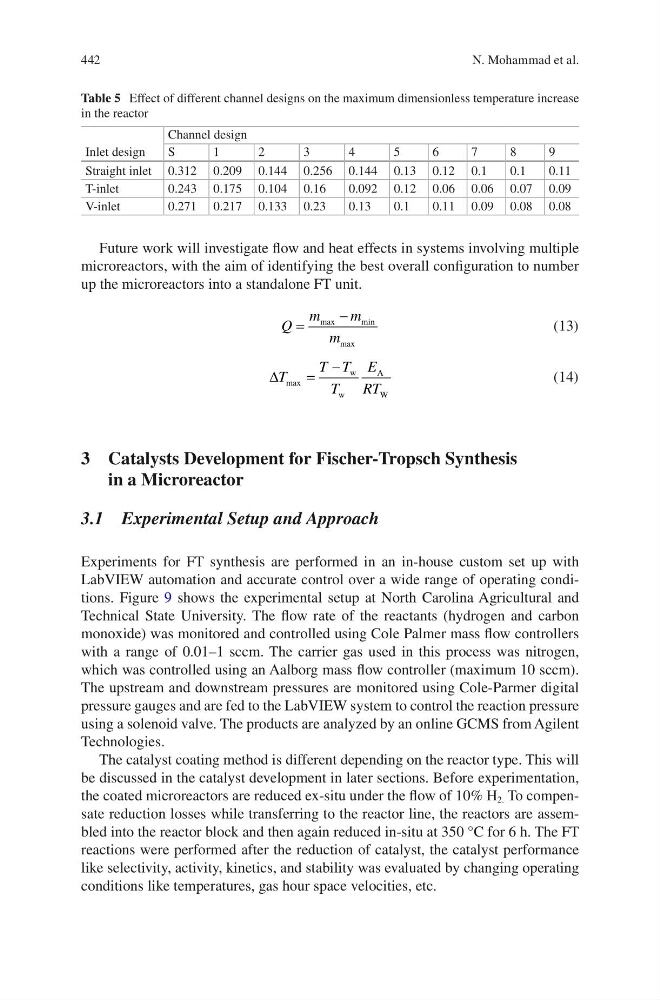
Table 5 Effect of different channel designs on the maximum dimensionless temperature increase
in the reactor
Inlet design
Channel design
S
1
2
3
4
5
6
7
8
9
Straight inlet 0.312 0.209 0.144 0.256 0.144 0.13 0.12 0.1
0.1
0.11
T-inlet
0.243 0.175 0.104 0.16
0.092 0.12 0.06 0.06 0.07 0.09
V-inlet
0.271 0.217 0.133 0.23
0.13
0.1
0.11 0.09 0.08 0.08
N. Mohammad et al.
Future work will investigate flow and heat effects in systems involving multiple
microreactors, with the aim of identifying the best overall configuration to number
up the microreactors into a standalone FT unit.
Q
m
m
m
=
-
max
m in
max
(13)
DT
T T
T
E
RT
max
w
w
A
W
=
-
(14)
3 Catalysts Development for Fischer-Tropsch Synthesis
in a Microreactor
3.1 Experimental Setup and Approach
Experiments for FT synthesis are performed in an in-house custom set up with
LabVIEW automation and accurate control over a wide range of operating conditions. Figure 9 shows the experimental setup at North Carolina Agricultural and
Technical State University. The flow rate of the reactants (hydrogen and carbon
monoxide) was monitored and controlled using Cole Palmer mass flow controllers
with a range of 0.01–1 sccm. The carrier gas used in this process was nitrogen,
which was controlled using an Aalborg mass flow controller (maximum 10 sccm).
The upstream and downstream pressures are monitored using Cole-Parmer digital
pressure gauges and are fed to the LabVIEW system to control the reaction pressure
using a solenoid valve. The products are analyzed by an online GCMS from Agilent
Technologies.
The catalyst coating method is different depending on the reactor type. This will
be discussed in the catalyst development in later sections. Before experimentation,
the coated microreactors are reduced ex-situ under the flow of 10% H 2. To compensate reduction losses while transferring to the reactor line, the reactors are assembled into the reactor block and then again reduced in-situ at 350 °C for 6 h. The FT
reactions were performed after the reduction of catalyst, the catalyst performance
like selectivity, activity, kinetics, and stability was evaluated by changing operating
conditions like temperatures, gas hour space velocities, etc.
Table 5 Effect of different channel designs on the maximum dimensionless temperature increase
in the reactor
Inlet design
Channel design
S
1
2
3
4
5
6
7
8
9
Straight inlet 0.312 0.209 0.144 0.256 0.144 0.13 0.12 0.1
0.1
0.11
T-inlet
0.243 0.175 0.104 0.16
0.092 0.12 0.06 0.06 0.07 0.09
V-inlet
0.271 0.217 0.133 0.23
0.13
0.1
0.11 0.09 0.08 0.08
N. Mohammad et al.