

240
EXAFS as per previous studies [53]. Gao et al. in 2015 have claimed Mo 4 C 2 as the
most stable Mo carbide nanocluster formed at MDA reaction conditions and reports
theoretical calculations showing methane C–H activation barrier of 112 kJ/mol at
Mo 4 C 2 cluster grafter over ZSM-5 channels [34]. Other forms of molybdenum carbide phase have also been reported using genetic algorithms (GA) such as MoC 3
(Mo 2 C 6 ) [54]. Pant and co-workers in 2018 have reported detailed theoretical calculations on Mo 4 C 2 and Mo 2 C 6 clusters showing results for C–H activation and C–C
coupling reactions providing ethylene intermediate as depicted form Figs. 4, 5, 6,
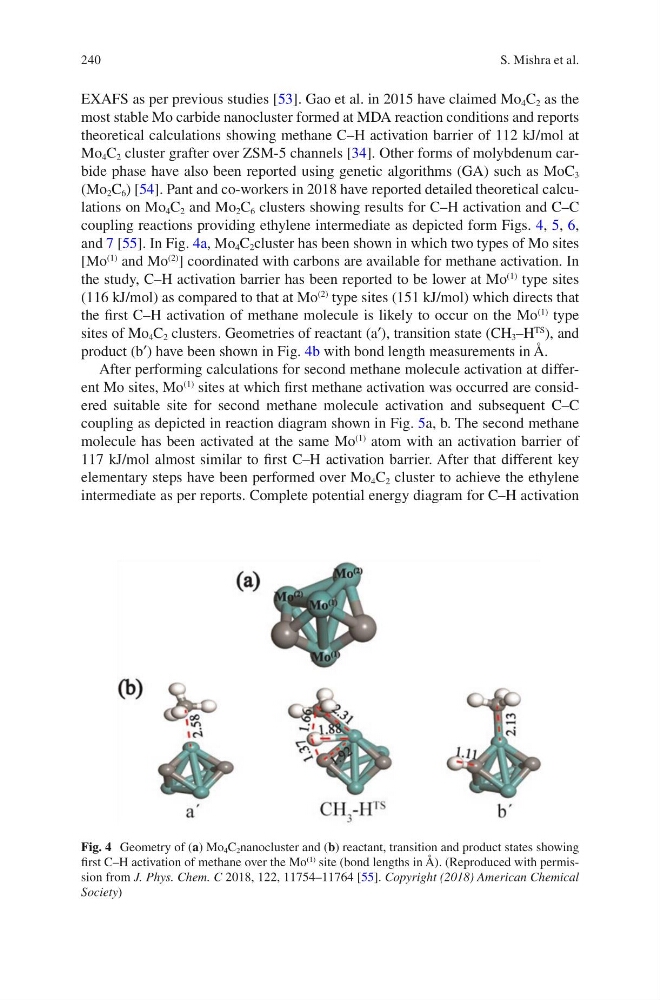
and 7 [55]. In Fig. 4a, Mo 4 C 2 cluster has been shown in which two types of Mo sites
[Mo
(1)
and Mo
(2)
] coordinated with carbons are available for methane activation. In
the study, C–H activation barrier has been reported to be lower at Mo
(1)
type sites
(116 kJ/mol) as compared to that at Mo
(2)
type sites (151 kJ/mol) which directs that
the first C–H activation of methane molecule is likely to occur on the Mo
(1)
type
sites of Mo 4 C 2 clusters. Geometries of reactant (a′), transition state (CH 3 –H
TS
), and
product (b′) have been shown in Fig. 4b with bond length measurements in Å.
After performing calculations for second methane molecule activation at different Mo sites, Mo
(1)
sites at which first methane activation was occurred are considered suitable site for second methane molecule activation and subsequent C–C
coupling as depicted in reaction diagram shown in Fig. 5a, b. The second methane
molecule has been activated at the same Mo
(1)
atom with an activation barrier of
117 kJ/mol almost similar to first C–H activation barrier. After that different key
elementary steps have been performed over Mo 4 C 2 cluster to achieve the ethylene
intermediate as per reports. Complete potential energy diagram for C–H activation
Fig. 4 Geometry of (a) Mo 4 C 2 nanocluster and (b) reactant, transition and product states showing
first C–H activation of methane over the Mo
(1) site (bond lengths in Å). (Reproduced with permission from J. Phys. Chem. C 2018, 122, 11754–11764 [55]. Copyright (2018) American Chemical
Society)
S. Mishra et al.
EXAFS as per previous studies [53]. Gao et al. in 2015 have claimed Mo 4 C 2 as the
most stable Mo carbide nanocluster formed at MDA reaction conditions and reports
theoretical calculations showing methane C–H activation barrier of 112 kJ/mol at
Mo 4 C 2 cluster grafter over ZSM-5 channels [34]. Other forms of molybdenum carbide phase have also been reported using genetic algorithms (GA) such as MoC 3
(Mo 2 C 6 ) [54]. Pant and co-workers in 2018 have reported detailed theoretical calculations on Mo 4 C 2 and Mo 2 C 6 clusters showing results for C–H activation and C–C
coupling reactions providing ethylene intermediate as depicted form Figs. 4, 5, 6,
and 7 [55]. In Fig. 4a, Mo 4 C 2 cluster has been shown in which two types of Mo sites
[Mo
(1)
and Mo
(2)
] coordinated with carbons are available for methane activation. In
the study, C–H activation barrier has been reported to be lower at Mo
(1)
type sites
(116 kJ/mol) as compared to that at Mo
(2)
type sites (151 kJ/mol) which directs that
the first C–H activation of methane molecule is likely to occur on the Mo
(1)
type
sites of Mo 4 C 2 clusters. Geometries of reactant (a′), transition state (CH 3 –H
TS
), and
product (b′) have been shown in Fig. 4b with bond length measurements in Å.
After performing calculations for second methane molecule activation at different Mo sites, Mo
(1)
sites at which first methane activation was occurred are considered suitable site for second methane molecule activation and subsequent C–C
coupling as depicted in reaction diagram shown in Fig. 5a, b. The second methane
molecule has been activated at the same Mo
(1)
atom with an activation barrier of
117 kJ/mol almost similar to first C–H activation barrier. After that different key
elementary steps have been performed over Mo 4 C 2 cluster to achieve the ethylene
intermediate as per reports. Complete potential energy diagram for C–H activation
Fig. 4 Geometry of (a) Mo 4 C 2 nanocluster and (b) reactant, transition and product states showing
first C–H activation of methane over the Mo
(1) site (bond lengths in Å). (Reproduced with permission from J. Phys. Chem. C 2018, 122, 11754–11764 [55]. Copyright (2018) American Chemical
Society)
S. Mishra et al.