

43
The size of the workforce is often seen as a good
economic indicator because it points to the
human resource capacity of the area to drive the
economy (Kotkin, 2007). Disagreements however have surfaced over whether emphasis should
be placed on primarily developing the professional class of workers or the service workers as
key engines to economic success in the twentyfirst century (Florida, 2002; Kotkin, 2007). SDG8
does well to focus on growth of STEM jobs as an
indicator of quality employment. Environmental
considerations should be considered as well as to
whether these companies produce a lot of waste
or pollution or whether they are more environmentally responsible companies (Wooster 2013).
GDP growth for the Houston metro was 2.9%
in 2016. This was higher than the national average. The San Jose metro had the highest GDP
growth rate of 6.6%. This was higher than the
2030 SDG target which is 5.8%. Houston ranks
23rd in the country on this indicator.
The percentage of STEM jobs for Houston
was equal to the national average of 11.9%.
STEM jobs are jobs in computers, science, engineering, healthcare, and technical occupations.
The top performing metro in the country San Jose
had 22.1% of jobs in STEM fields. Houston ranks
66th in the country on this indicator.
The unemployment rate for the Houston metro
was 5.1% in 2017. This is higher than the national
average of 4.3% and higher than the 2030 SDG
target of 3.7%. The top performing metro in the
country Urban Honolulu had a 2.3% unemployment rate. Houston ranks 85th in the country on
this indicator.
The percentage of youth (ages 16–24) who are
not in education, employment, or training
(NEET) is considered the metric for disconnected
youth. In the Houston metro, 14.2% of youth are
in the NEET category. This is higher than the
national average of 13.5% and higher than the
2030 SDG target of 8.3%. The metro with the
lowest NEET rate was Omaha, with 7.7%.
Houston ranks 56th in the country on this
indicator.
4.4.9 SDG9: Industry, Innovation, and Infrastructure
SDG9
Data
N
Minimum
Maximum
Mean
Houston
Utility patent grants
1/1000
100
0.3
53.3
4.6
4.3
Broadband
%
100
64.6
90.8
82.6
83.3
Source: (Espey et al. 2018). Patent applications 2012–2015 data. Broadband connection 2016 data
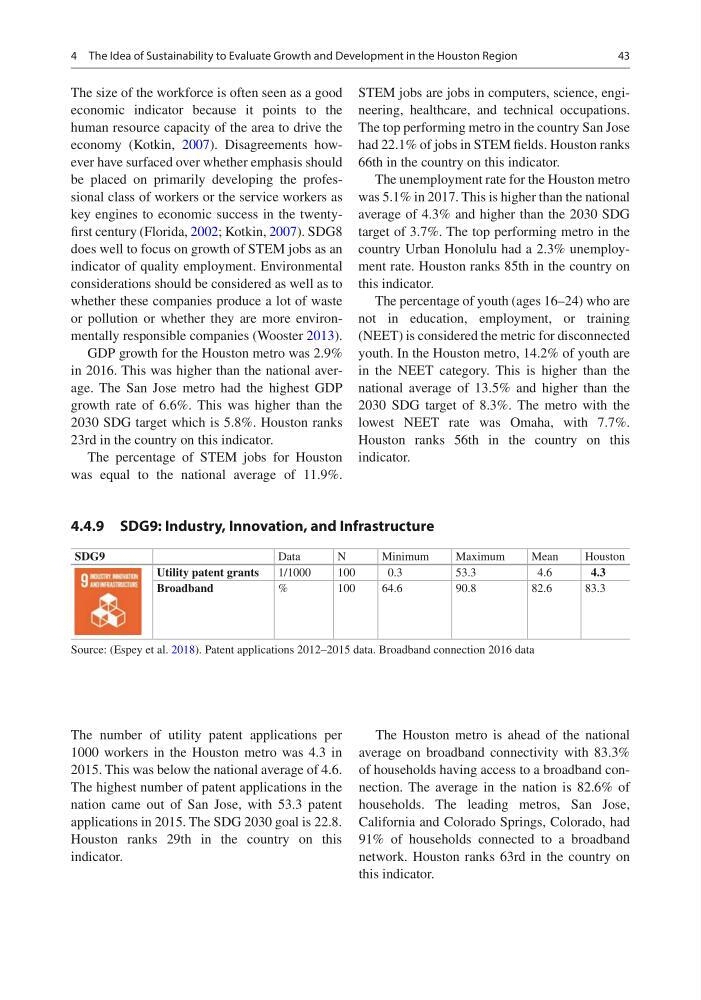
The number of utility patent applications per
1000 workers in the Houston metro was 4.3 in
2015. This was below the national average of 4.6.
The highest number of patent applications in the
nation came out of San Jose, with 53.3 patent
applications in 2015. The SDG 2030 goal is 22.8.
Houston ranks 29th in the country on this
indicator.
The Houston metro is ahead of the national
average on broadband connectivity with 83.3%
of households having access to a broadband connection. The average in the nation is 82.6% of
households. The leading metros, San Jose,
California and Colorado Springs, Colorado, had
91% of households connected to a broadband
network. Houston ranks 63rd in the country on
this indicator.
4 The Idea of Sustainability to Evaluate Growth and Development in the Houston Region
The size of the workforce is often seen as a good
economic indicator because it points to the
human resource capacity of the area to drive the
economy (Kotkin, 2007). Disagreements however have surfaced over whether emphasis should
be placed on primarily developing the professional class of workers or the service workers as
key engines to economic success in the twentyfirst century (Florida, 2002; Kotkin, 2007). SDG8
does well to focus on growth of STEM jobs as an
indicator of quality employment. Environmental
considerations should be considered as well as to
whether these companies produce a lot of waste
or pollution or whether they are more environmentally responsible companies (Wooster 2013).
GDP growth for the Houston metro was 2.9%
in 2016. This was higher than the national average. The San Jose metro had the highest GDP
growth rate of 6.6%. This was higher than the
2030 SDG target which is 5.8%. Houston ranks
23rd in the country on this indicator.
The percentage of STEM jobs for Houston
was equal to the national average of 11.9%.
STEM jobs are jobs in computers, science, engineering, healthcare, and technical occupations.
The top performing metro in the country San Jose
had 22.1% of jobs in STEM fields. Houston ranks
66th in the country on this indicator.
The unemployment rate for the Houston metro
was 5.1% in 2017. This is higher than the national
average of 4.3% and higher than the 2030 SDG
target of 3.7%. The top performing metro in the
country Urban Honolulu had a 2.3% unemployment rate. Houston ranks 85th in the country on
this indicator.
The percentage of youth (ages 16–24) who are
not in education, employment, or training
(NEET) is considered the metric for disconnected
youth. In the Houston metro, 14.2% of youth are
in the NEET category. This is higher than the
national average of 13.5% and higher than the
2030 SDG target of 8.3%. The metro with the
lowest NEET rate was Omaha, with 7.7%.
Houston ranks 56th in the country on this
indicator.
4.4.9 SDG9: Industry, Innovation, and Infrastructure
SDG9
Data
N
Minimum
Maximum
Mean
Houston
Utility patent grants
1/1000
100
0.3
53.3
4.6
4.3
Broadband
%
100
64.6
90.8
82.6
83.3
Source: (Espey et al. 2018). Patent applications 2012–2015 data. Broadband connection 2016 data
The number of utility patent applications per
1000 workers in the Houston metro was 4.3 in
2015. This was below the national average of 4.6.
The highest number of patent applications in the
nation came out of San Jose, with 53.3 patent
applications in 2015. The SDG 2030 goal is 22.8.
Houston ranks 29th in the country on this
indicator.
The Houston metro is ahead of the national
average on broadband connectivity with 83.3%
of households having access to a broadband connection. The average in the nation is 82.6% of
households. The leading metros, San Jose,
California and Colorado Springs, Colorado, had
91% of households connected to a broadband
network. Houston ranks 63rd in the country on
this indicator.
4 The Idea of Sustainability to Evaluate Growth and Development in the Houston Region