

122
ily, there was no significant difference between
groups (F (9,51) = .93, p = .507).
A Tukey post hoc test revealed that there is a
statistically significant difference among the age
groups from 18 through 24 in the case of singlefamily residential units. There are no Tukey test
results for duplexes and triplexes and multifamily because of the low number of cases in each
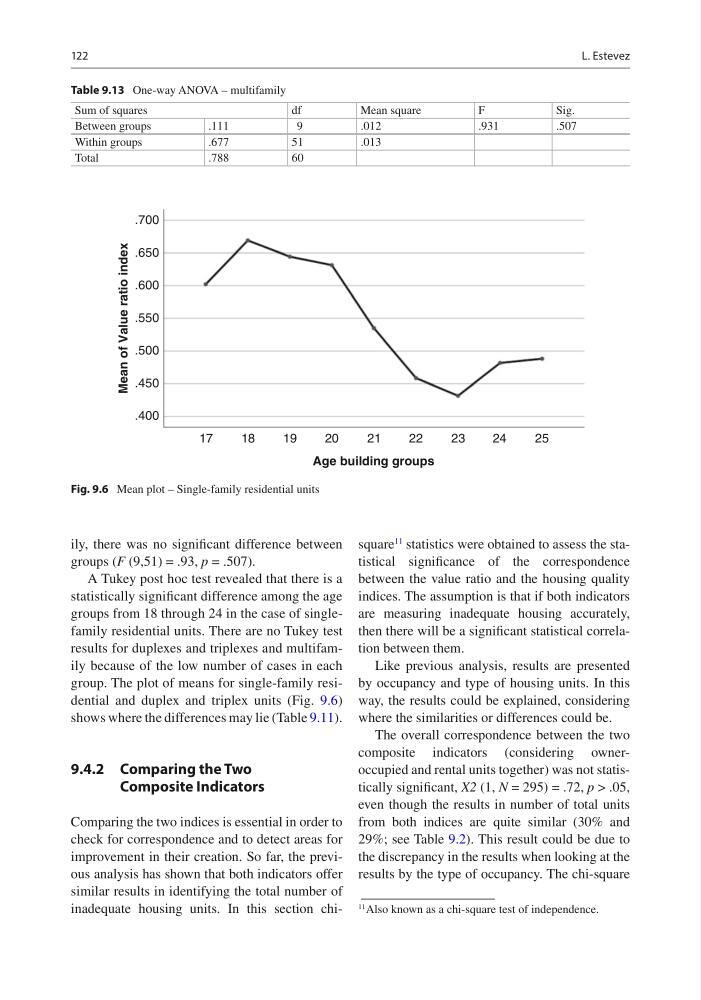
group. The plot of means for single-family residential and duplex and triplex units (Fig. 9.6)
shows where the differences may lie (Table 9.11).
9.4.2 Comparing the Two
Composite Indicators
Comparing the two indices is essential in order to
check for correspondence and to detect areas for
improvement in their creation. So far, the previous analysis has shown that both indicators offer
similar results in identifying the total number of
inadequate housing units. In this section chisquare
11
statistics were obtained to assess the statistical significance of the correspondence
between the value ratio and the housing quality
indices. The assumption is that if both indicators
are measuring inadequate housing accurately,
then there will be a significant statistical correlation between them.
Like previous analysis, results are presented
by occupancy and type of housing units. In this
way, the results could be explained, considering
where the similarities or differences could be.
The overall correspondence between the two
composite indicators (considering owneroccupied and rental units together) was not statistically significant, X2 (1, N = 295) = .72, p > .05,
even though the results in number of total units
from both indices are quite similar (30% and
29%; see Table 9.2). This result could be due to
the discrepancy in the results when looking at the
results by the type of occupancy. The chi-square
11 Also known as a chi-square test of independence.
.700
.650
.550
.450
.400
.500
.600
17
18
19
20
21
22
23
24
25
Age building groups
Mean of Value ratio index
Fig. 9.6 Mean plot – Single-family residential units
Table 9.13 One-way ANOVA – multifamily
Sum of squares
df
Mean square
F
Sig.
Between groups
.111
9
.012
.931
.507
Within groups
.677
51
.013
Total
.788
60
L. Estevez
ily, there was no significant difference between
groups (F (9,51) = .93, p = .507).
A Tukey post hoc test revealed that there is a
statistically significant difference among the age
groups from 18 through 24 in the case of singlefamily residential units. There are no Tukey test
results for duplexes and triplexes and multifamily because of the low number of cases in each
group. The plot of means for single-family residential and duplex and triplex units (Fig. 9.6)
shows where the differences may lie (Table 9.11).
9.4.2 Comparing the Two
Composite Indicators
Comparing the two indices is essential in order to
check for correspondence and to detect areas for
improvement in their creation. So far, the previous analysis has shown that both indicators offer
similar results in identifying the total number of
inadequate housing units. In this section chisquare
11
statistics were obtained to assess the statistical significance of the correspondence
between the value ratio and the housing quality
indices. The assumption is that if both indicators
are measuring inadequate housing accurately,
then there will be a significant statistical correlation between them.
Like previous analysis, results are presented
by occupancy and type of housing units. In this
way, the results could be explained, considering
where the similarities or differences could be.
The overall correspondence between the two
composite indicators (considering owneroccupied and rental units together) was not statistically significant, X2 (1, N = 295) = .72, p > .05,
even though the results in number of total units
from both indices are quite similar (30% and
29%; see Table 9.2). This result could be due to
the discrepancy in the results when looking at the
results by the type of occupancy. The chi-square
11 Also known as a chi-square test of independence.
.700
.650
.550
.450
.400
.500
.600
17
18
19
20
21
22
23
24
25
Age building groups
Mean of Value ratio index
Fig. 9.6 Mean plot – Single-family residential units
Table 9.13 One-way ANOVA – multifamily
Sum of squares
df
Mean square
F
Sig.
Between groups
.111
9
.012
.931
.507
Within groups
.677
51
.013
Total
.788
60
L. Estevez