

116
147 (43%) are single-family residential, 148
(43%) duplexes and triplexes, and 50 (14%) multifamily units.
Regarding the value ratio index, 362 housing
units were considered. By occupancy, 231 (77%)
are rental and 70 (23%) owner-occupied. For
type of housing units, 149 (41%) are singlefamily residential, 152 (42%) duplexes and triplexes, and 61 (17%) multifamily.
Another important element to consider in the
analysis was age of buildings. Therefore, buildexemption in the administrative records of tax
assessments.
ings were grouped by age following AHS and
Smith’s (2003) experience when analyzing when
inadequate units start to appear in the housing
stock. Units were aggregated according to their
age in groups. The first ten groups (groups 1
through 10) are for every year a unit was built.
Groups 11 through 15 consider 5-year cohorts.
Groups 16 through 25 are for units built every 10
years. The oldest building in the data is 151 years
old. The information about age reveals the context
of the neighborhood, a Midwestern old downtown
area (see Fig. 9.3 for age groups). It is important
to note that no unit appears in groups 1–11 because
the most recent unit was built 17 years ago.
The benefit of considering age is twofold. It
provides the amount of inadequate housing units
at a specific point in time, and it allowed for later
statistically testing the difference between units
at different ages.
Both composite indicators yield an almost
identical number of units in need of rehabilitation
(value ratio index = 30% and housing quality
index = 29%). Both indices detected an increase
in the presence of inadequate units as the stock
grows older. However, while the value ratio index
found an increasing proportion of units in need of
rehab the older the stock got all the way to the
97
87
84
83
83
86
87
90
77
87
3
13
16
17
17
14
13
10
23
13
0%
20%
40%
60%
8 0%
100%
Access to unit
Chimneys
Detached garage
Door/windows
Exterior surfaces/siding
Foundation
Garbage and debris
Roof and gutters
Stairs, rail and porches
Yard
Adequate
Inadequate
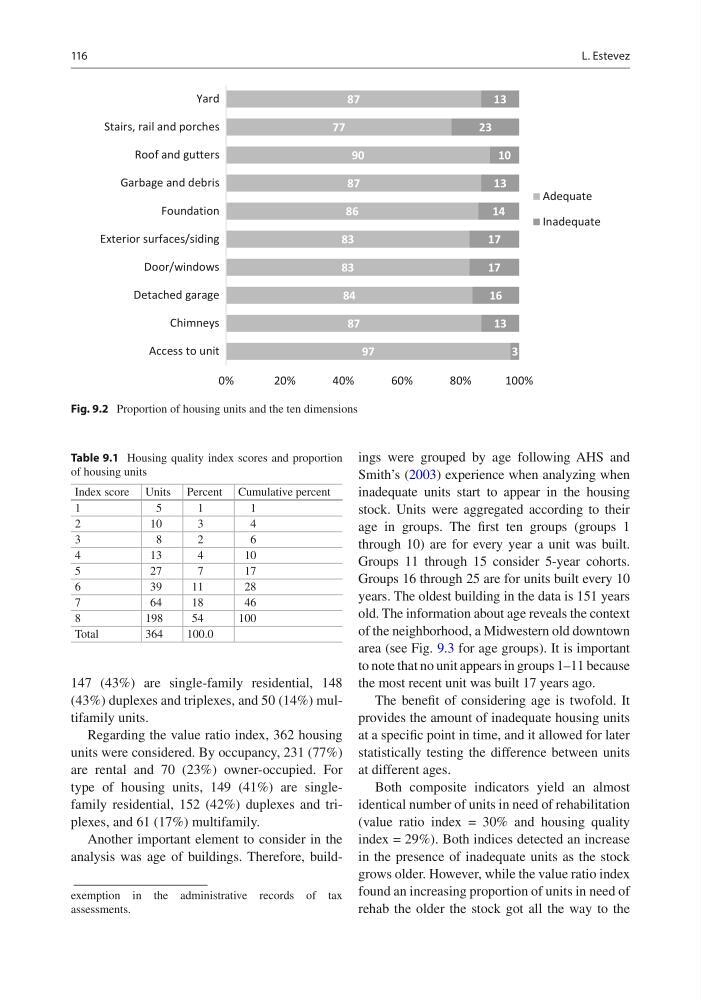
Fig. 9.2 Proportion of housing units and the ten dimensions
Table 9.1 Housing quality index scores and proportion
of housing units
Index score Units Percent Cumulative percent
1
5
1
1
2
10
3
4
3
8
2
6
4
13
4
10
5
27
7
17
6
39
11
28
7
64
18
46
8
198
54
100
Total
364
100.0
L. Estevez
147 (43%) are single-family residential, 148
(43%) duplexes and triplexes, and 50 (14%) multifamily units.
Regarding the value ratio index, 362 housing
units were considered. By occupancy, 231 (77%)
are rental and 70 (23%) owner-occupied. For
type of housing units, 149 (41%) are singlefamily residential, 152 (42%) duplexes and triplexes, and 61 (17%) multifamily.
Another important element to consider in the
analysis was age of buildings. Therefore, buildexemption in the administrative records of tax
assessments.
ings were grouped by age following AHS and
Smith’s (2003) experience when analyzing when
inadequate units start to appear in the housing
stock. Units were aggregated according to their
age in groups. The first ten groups (groups 1
through 10) are for every year a unit was built.
Groups 11 through 15 consider 5-year cohorts.
Groups 16 through 25 are for units built every 10
years. The oldest building in the data is 151 years
old. The information about age reveals the context
of the neighborhood, a Midwestern old downtown
area (see Fig. 9.3 for age groups). It is important
to note that no unit appears in groups 1–11 because
the most recent unit was built 17 years ago.
The benefit of considering age is twofold. It
provides the amount of inadequate housing units
at a specific point in time, and it allowed for later
statistically testing the difference between units
at different ages.
Both composite indicators yield an almost
identical number of units in need of rehabilitation
(value ratio index = 30% and housing quality
index = 29%). Both indices detected an increase
in the presence of inadequate units as the stock
grows older. However, while the value ratio index
found an increasing proportion of units in need of
rehab the older the stock got all the way to the
97
87
84
83
83
86
87
90
77
87
3
13
16
17
17
14
13
10
23
13
0%
20%
40%
60%
8 0%
100%
Access to unit
Chimneys
Detached garage
Door/windows
Exterior surfaces/siding
Foundation
Garbage and debris
Roof and gutters
Stairs, rail and porches
Yard
Adequate
Inadequate
Fig. 9.2 Proportion of housing units and the ten dimensions
Table 9.1 Housing quality index scores and proportion
of housing units
Index score Units Percent Cumulative percent
1
5
1
1
2
10
3
4
3
8
2
6
4
13
4
10
5
27
7
17
6
39
11
28
7
64
18
46
8
198
54
100
Total
364
100.0
L. Estevez