

72
R. Bruggemann et al.
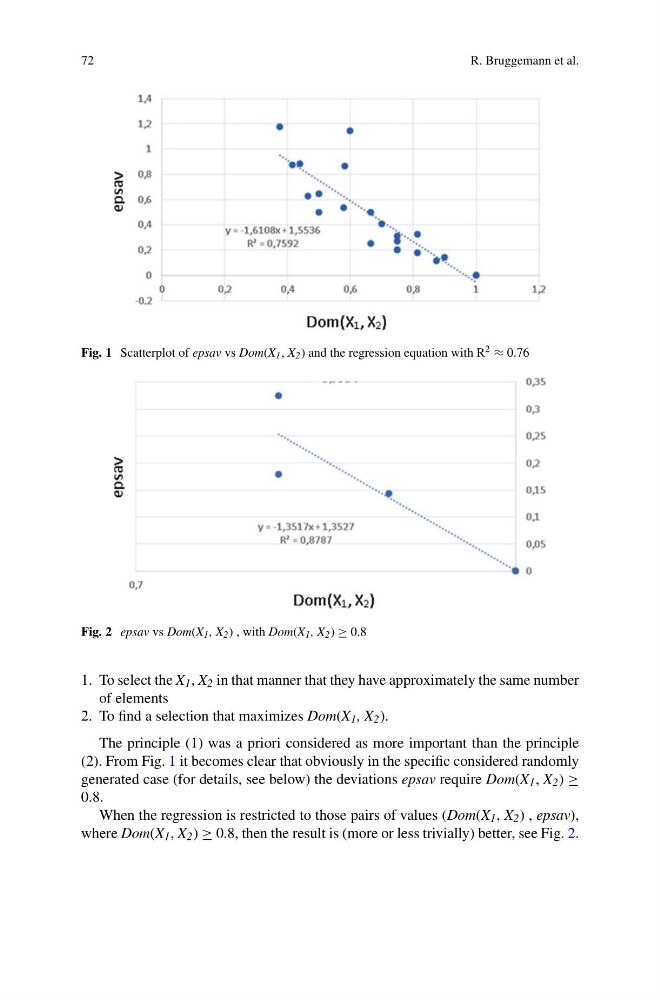
Fig. 1 Scatterplot of epsav vs Dom(X 1 , X 2 ) and the regression equation with R 2 ≈ 0.76
Fig. 2 epsav vs Dom(X 1 , X 2 ) , with Dom(X 1 , X 2 ) ≥ 0.8
1. To select the X 1 , X 2 in that manner that they have approximately the same number
of elements
2. To find a selection that maximizes Dom(X 1 , X 2 ).
The principle (1) was a priori considered as more important than the principle
(2). From Fig. 1 it becomes clear that obviously in the specific considered randomly
generated case (for details, see below) the deviations epsav require Dom(X 1 , X 2 ) ≥
0.8.
When the regression is restricted to those pairs of values (Dom(X 1 , X 2 ) , epsav),
where Dom(X 1 , X 2 ) ≥ 0.8, then the result is (more or less trivially) better, see Fig. 2.
R. Bruggemann et al.
Fig. 1 Scatterplot of epsav vs Dom(X 1 , X 2 ) and the regression equation with R 2 ≈ 0.76
Fig. 2 epsav vs Dom(X 1 , X 2 ) , with Dom(X 1 , X 2 ) ≥ 0.8
1. To select the X 1 , X 2 in that manner that they have approximately the same number
of elements
2. To find a selection that maximizes Dom(X 1 , X 2 ).
The principle (1) was a priori considered as more important than the principle
(2). From Fig. 1 it becomes clear that obviously in the specific considered randomly
generated case (for details, see below) the deviations epsav require Dom(X 1 , X 2 ) ≥
0.8.
When the regression is restricted to those pairs of values (Dom(X 1 , X 2 ) , epsav),
where Dom(X 1 , X 2 ) ≥ 0.8, then the result is (more or less trivially) better, see Fig. 2.