

Uncertainty in Weights for Composite Indicators Generated by Weighted Sums
57
where, R i (x) is the rank by the i th indicator of nation x.
From CI, Eq. 13 the following ranking is deduced (from the worst to the best):
(UK, US, HU, AU, PT, FR, CZ, PL, GR, CA, DE, BE, IRE, IT, NO, SU, ES, FI,
DK, SW, NE)
Any decision maker may see that “his” nation is “good” with respect to some
indicator, even if his nation got a bad overall position in the ranking. Thus,
Italy is good in the FAMILY indicator, “fa”. Naturally the question arises, is not
“fa” more important than the others, say “ed”, education, and give “fa” a higher
weight? UNICEF, however, used the same weight for each indicator. Hence, for any
indicator, there is the same trade-off compensation: good points may compensate
bad points. However, if, trade-off compensation is allowed, then questioning the
uniform weight of any indicator in the index is indeed justified. Thus, Italy would
get a better overall position if the weight for “fa” would get a higher value. However,
such procedure would make decision makers, feeling responsible for their own
nation unhappy. Poland for example is good in education, and would therefore like
to see this indicator given a higher weight. Hence, it may be a good idea to keep the
six indicators separated, but simultaneously analyzed rather than composited.
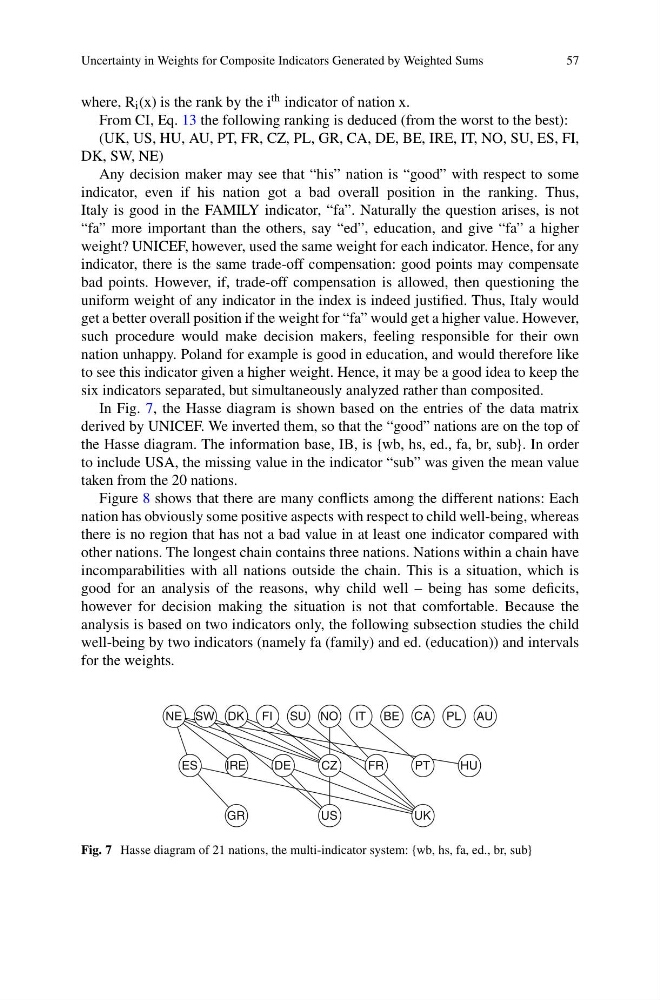
In Fig. 7, the Hasse diagram is shown based on the entries of the data matrix
derived by UNICEF. We inverted them, so that the “good” nations are on the top of
the Hasse diagram. The information base, IB, is {wb, hs, ed., fa, br, sub}. In order
to include USA, the missing value in the indicator “sub” was given the mean value
taken from the 20 nations.
Figure 8 shows that there are many conflicts among the different nations: Each
nation has obviously some positive aspects with respect to child well-being, whereas
there is no region that has not a bad value in at least one indicator compared with
other nations. The longest chain contains three nations. Nations within a chain have
incomparabilities with all nations outside the chain. This is a situation, which is
good for an analysis of the reasons, why child well – being has some deficits,
however for decision making the situation is not that comfortable. Because the
analysis is based on two indicators only, the following subsection studies the child
well-being by two indicators (namely fa (family) and ed. (education)) and intervals
for the weights.
NE SW
ES
IRE
DE
CZ
FR
PT
HU
UK
US
GR
DK FI SU NO IT BE CA PL AU
Fig. 7 Hasse diagram of 21 nations, the multi-indicator system: {wb, hs, fa, ed., br, sub}
57
where, R i (x) is the rank by the i th indicator of nation x.
From CI, Eq. 13 the following ranking is deduced (from the worst to the best):
(UK, US, HU, AU, PT, FR, CZ, PL, GR, CA, DE, BE, IRE, IT, NO, SU, ES, FI,
DK, SW, NE)
Any decision maker may see that “his” nation is “good” with respect to some
indicator, even if his nation got a bad overall position in the ranking. Thus,
Italy is good in the FAMILY indicator, “fa”. Naturally the question arises, is not
“fa” more important than the others, say “ed”, education, and give “fa” a higher
weight? UNICEF, however, used the same weight for each indicator. Hence, for any
indicator, there is the same trade-off compensation: good points may compensate
bad points. However, if, trade-off compensation is allowed, then questioning the
uniform weight of any indicator in the index is indeed justified. Thus, Italy would
get a better overall position if the weight for “fa” would get a higher value. However,
such procedure would make decision makers, feeling responsible for their own
nation unhappy. Poland for example is good in education, and would therefore like
to see this indicator given a higher weight. Hence, it may be a good idea to keep the
six indicators separated, but simultaneously analyzed rather than composited.
In Fig. 7, the Hasse diagram is shown based on the entries of the data matrix
derived by UNICEF. We inverted them, so that the “good” nations are on the top of
the Hasse diagram. The information base, IB, is {wb, hs, ed., fa, br, sub}. In order
to include USA, the missing value in the indicator “sub” was given the mean value
taken from the 20 nations.
Figure 8 shows that there are many conflicts among the different nations: Each
nation has obviously some positive aspects with respect to child well-being, whereas
there is no region that has not a bad value in at least one indicator compared with
other nations. The longest chain contains three nations. Nations within a chain have
incomparabilities with all nations outside the chain. This is a situation, which is
good for an analysis of the reasons, why child well – being has some deficits,
however for decision making the situation is not that comfortable. Because the
analysis is based on two indicators only, the following subsection studies the child
well-being by two indicators (namely fa (family) and ed. (education)) and intervals
for the weights.
NE SW
ES
IRE
DE
CZ
FR
PT
HU
UK
US
GR
DK FI SU NO IT BE CA PL AU
Fig. 7 Hasse diagram of 21 nations, the multi-indicator system: {wb, hs, fa, ed., br, sub}