

Uncertainty in Weights for Composite Indicators Generated by Weighted Sums
55
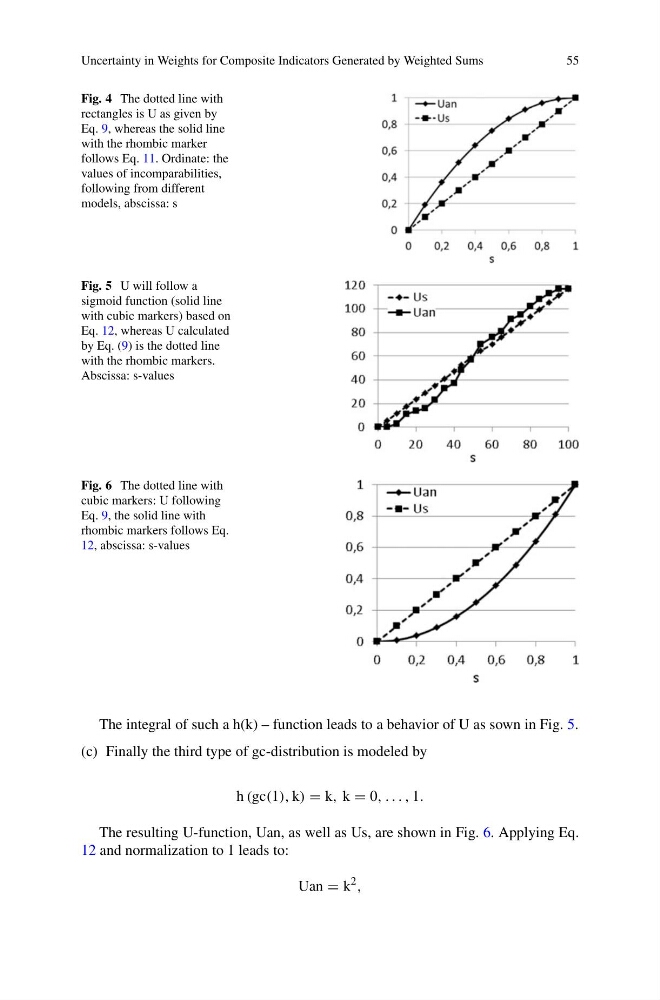
Fig. 4 The dotted line with
rectangles is U as given by
Eq. 9, whereas the solid line
with the rhombic marker
follows Eq. 11. Ordinate: the
values of incomparabilities,
following from different
models, abscissa: s
Fig. 5 U will follow a
sigmoid function (solid line
with cubic markers) based on
Eq. 12, whereas U calculated
by Eq. (9) is the dotted line
with the rhombic markers.
Abscissa: s-values
Fig. 6 The dotted line with
cubic markers: U following
Eq. 9, the solid line with
rhombic markers follows Eq.
12, abscissa: s-values
The integral of such a h(k) – function leads to a behavior of U as sown in Fig. 5.
(c) Finally the third type of gc-distribution is modeled by
h (gc(1), k) = k, k = 0, . . . , 1.
The resulting U-function, Uan, as well as Us, are shown in Fig. 6. Applying Eq.
12 and normalization to 1 leads to:
Uan = k
2 ,
55
Fig. 4 The dotted line with
rectangles is U as given by
Eq. 9, whereas the solid line
with the rhombic marker
follows Eq. 11. Ordinate: the
values of incomparabilities,
following from different
models, abscissa: s
Fig. 5 U will follow a
sigmoid function (solid line
with cubic markers) based on
Eq. 12, whereas U calculated
by Eq. (9) is the dotted line
with the rhombic markers.
Abscissa: s-values
Fig. 6 The dotted line with
cubic markers: U following
Eq. 9, the solid line with
rhombic markers follows Eq.
12, abscissa: s-values
The integral of such a h(k) – function leads to a behavior of U as sown in Fig. 5.
(c) Finally the third type of gc-distribution is modeled by
h (gc(1), k) = k, k = 0, . . . , 1.
The resulting U-function, Uan, as well as Us, are shown in Fig. 6. Applying Eq.
12 and normalization to 1 leads to:
Uan = k
2 ,