

Indicators in the Framework of Partial Order
19
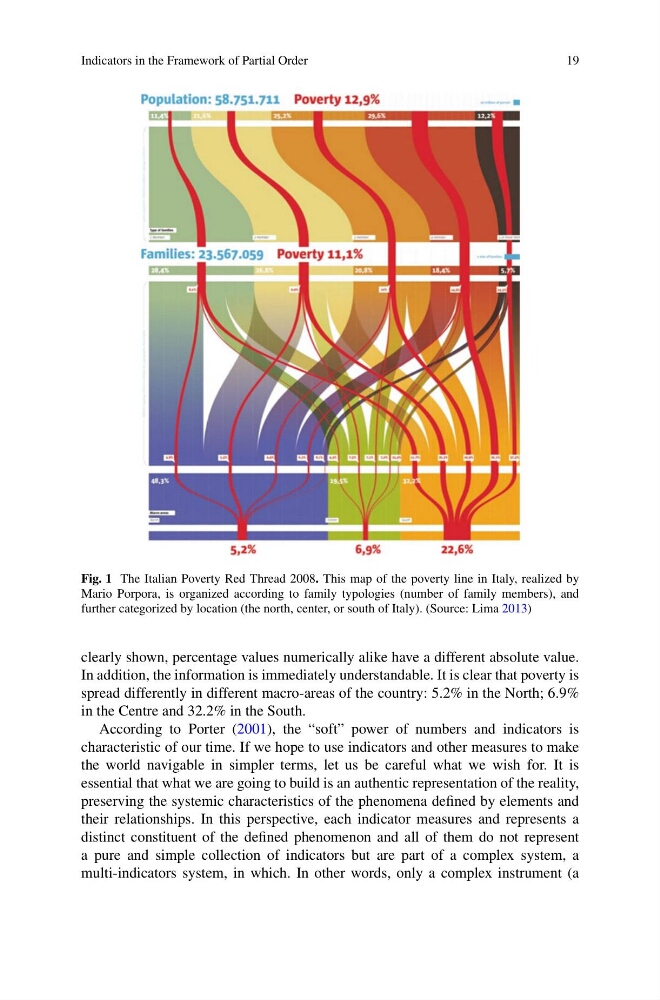
Fig. 1 The Italian Poverty Red Thread 2008. This map of the poverty line in Italy, realized by
Mario Porpora, is organized according to family typologies (number of family members), and
further categorized by location (the north, center, or south of Italy). (Source: Lima 2013)
clearly shown, percentage values numerically alike have a different absolute value.
In addition, the information is immediately understandable. It is clear that poverty is
spread differently in different macro-areas of the country: 5.2% in the North; 6.9%
in the Centre and 32.2% in the South.
According to Porter (2001), the “soft” power of numbers and indicators is
characteristic of our time. If we hope to use indicators and other measures to make
the world navigable in simpler terms, let us be careful what we wish for. It is
essential that what we are going to build is an authentic representation of the reality,
preserving the systemic characteristics of the phenomena defined by elements and
their relationships. In this perspective, each indicator measures and represents a
distinct constituent of the defined phenomenon and all of them do not represent
a pure and simple collection of indicators but are part of a complex system, a
multi-indicators system, in which. In other words, only a complex instrument (a
19
Fig. 1 The Italian Poverty Red Thread 2008. This map of the poverty line in Italy, realized by
Mario Porpora, is organized according to family typologies (number of family members), and
further categorized by location (the north, center, or south of Italy). (Source: Lima 2013)
clearly shown, percentage values numerically alike have a different absolute value.
In addition, the information is immediately understandable. It is clear that poverty is
spread differently in different macro-areas of the country: 5.2% in the North; 6.9%
in the Centre and 32.2% in the South.
According to Porter (2001), the “soft” power of numbers and indicators is
characteristic of our time. If we hope to use indicators and other measures to make
the world navigable in simpler terms, let us be careful what we wish for. It is
essential that what we are going to build is an authentic representation of the reality,
preserving the systemic characteristics of the phenomena defined by elements and
their relationships. In this perspective, each indicator measures and represents a
distinct constituent of the defined phenomenon and all of them do not represent
a pure and simple collection of indicators but are part of a complex system, a
multi-indicators system, in which. In other words, only a complex instrument (a