

10
J. Wittmann
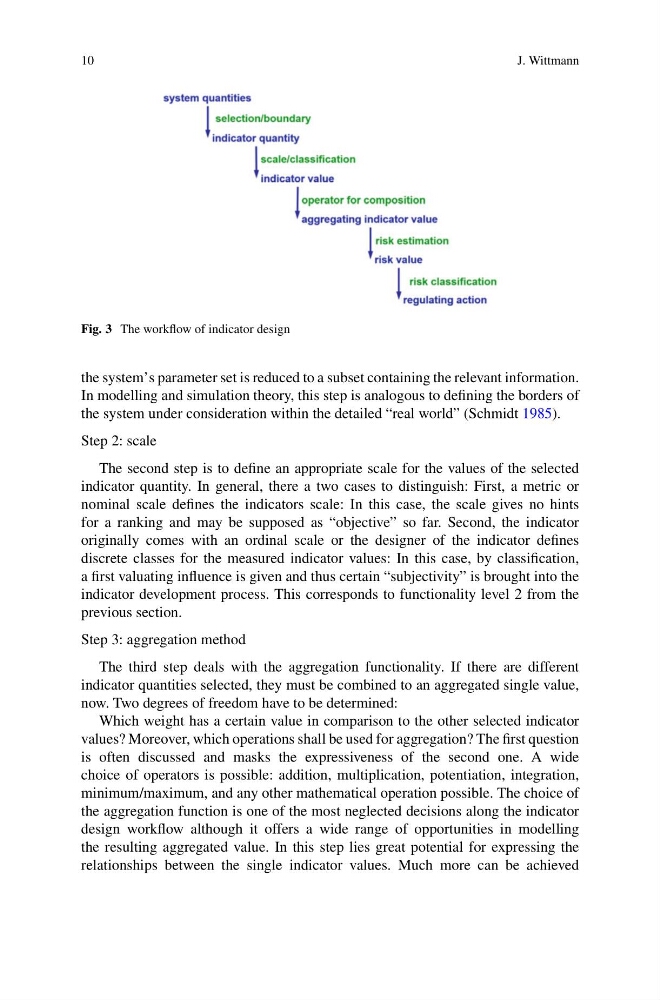
Fig. 3 The workflow of indicator design
the system’s parameter set is reduced to a subset containing the relevant information.
In modelling and simulation theory, this step is analogous to defining the borders of
the system under consideration within the detailed “real world” (Schmidt 1985).
Step 2: scale
The second step is to define an appropriate scale for the values of the selected
indicator quantity. In general, there a two cases to distinguish: First, a metric or
nominal scale defines the indicators scale: In this case, the scale gives no hints
for a ranking and may be supposed as “objective” so far. Second, the indicator
originally comes with an ordinal scale or the designer of the indicator defines
discrete classes for the measured indicator values: In this case, by classification,
a first valuating influence is given and thus certain “subjectivity” is brought into the
indicator development process. This corresponds to functionality level 2 from the
previous section.
Step 3: aggregation method
The third step deals with the aggregation functionality. If there are different
indicator quantities selected, they must be combined to an aggregated single value,
now. Two degrees of freedom have to be determined:
Which weight has a certain value in comparison to the other selected indicator
values? Moreover, which operations shall be used for aggregation? The first question
is often discussed and masks the expressiveness of the second one. A wide
choice of operators is possible: addition, multiplication, potentiation, integration,
minimum/maximum, and any other mathematical operation possible. The choice of
the aggregation function is one of the most neglected decisions along the indicator
design workflow although it offers a wide range of opportunities in modelling
the resulting aggregated value. In this step lies great potential for expressing the
relationships between the single indicator values. Much more can be achieved
J. Wittmann
Fig. 3 The workflow of indicator design
the system’s parameter set is reduced to a subset containing the relevant information.
In modelling and simulation theory, this step is analogous to defining the borders of
the system under consideration within the detailed “real world” (Schmidt 1985).
Step 2: scale
The second step is to define an appropriate scale for the values of the selected
indicator quantity. In general, there a two cases to distinguish: First, a metric or
nominal scale defines the indicators scale: In this case, the scale gives no hints
for a ranking and may be supposed as “objective” so far. Second, the indicator
originally comes with an ordinal scale or the designer of the indicator defines
discrete classes for the measured indicator values: In this case, by classification,
a first valuating influence is given and thus certain “subjectivity” is brought into the
indicator development process. This corresponds to functionality level 2 from the
previous section.
Step 3: aggregation method
The third step deals with the aggregation functionality. If there are different
indicator quantities selected, they must be combined to an aggregated single value,
now. Two degrees of freedom have to be determined:
Which weight has a certain value in comparison to the other selected indicator
values? Moreover, which operations shall be used for aggregation? The first question
is often discussed and masks the expressiveness of the second one. A wide
choice of operators is possible: addition, multiplication, potentiation, integration,
minimum/maximum, and any other mathematical operation possible. The choice of
the aggregation function is one of the most neglected decisions along the indicator
design workflow although it offers a wide range of opportunities in modelling
the resulting aggregated value. In this step lies great potential for expressing the
relationships between the single indicator values. Much more can be achieved