

PyHasse, a Software Package for Applicational Studies of Partial Orderings
295
4 An Example of Application of PyHasse
In the following sections the application of both PyHasse software packages is
demonstrated. We apply both variants of PyHasse to the generation of a Hasse
diagram of eight Rhine regions, which are characterized by 4 indicators, describing
the pollution of the herb layer by lead, cadmium, zinc and sulfur (in mg/kg dry
mass). These indicators are denoted by the chemical symbols, i.e. Pb, Cd, Zn and
S. The idea behind this monitoring study by the environmental protection agency
of Baden-Württemberg [ . . . ] (in the following often abbreviated as “bawue”) is to
identify transport mechanisms.
4.1 Data Matrix
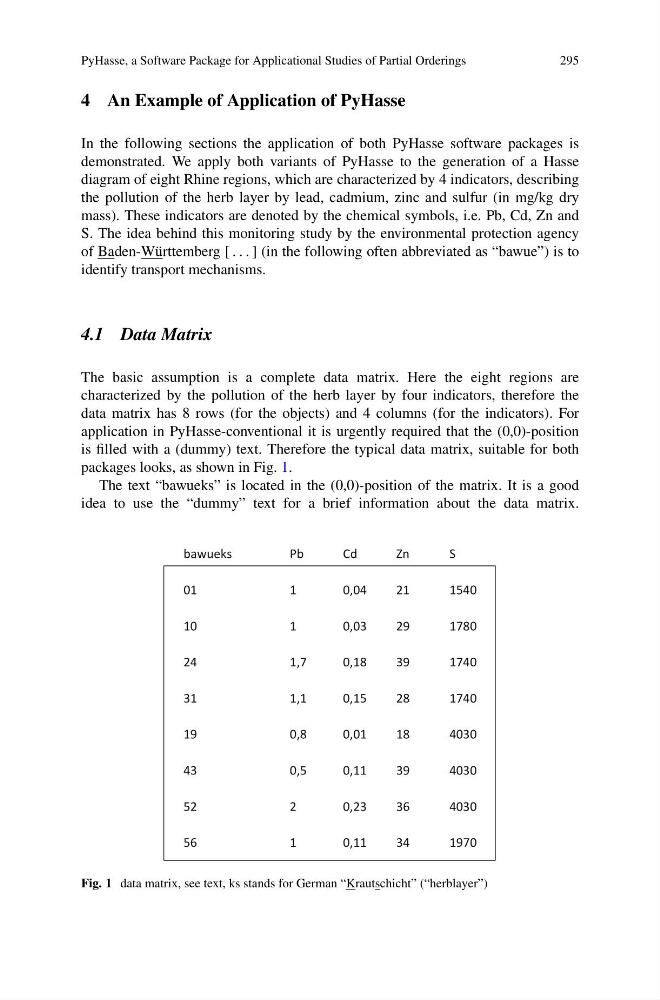
The basic assumption is a complete data matrix. Here the eight regions are
characterized by the pollution of the herb layer by four indicators, therefore the
data matrix has 8 rows (for the objects) and 4 columns (for the indicators). For
application in PyHasse-conventional it is urgently required that the (0,0)-position
is filled with a (dummy) text. Therefore the typical data matrix, suitable for both
packages looks, as shown in Fig. 1.
The text “bawueks” is located in the (0,0)-position of the matrix. It is a good
idea to use the “dummy” text for a brief information about the data matrix.
bawueks
Pb
Cd
Zn
S
01
1
0,04
21
1540
10
1
0,03
29
1780
24
1,7
0,18
39
1740
31
1,1
0,15
28
1740
19
0,8
0,01
18
4030
43
0,5
0,11
39
4030
52
2
0,23
36
4030
56
1
0,11
34
1970
Fig. 1 data matrix, see text, ks stands for German “Krautschicht” (“herblayer”)
295
4 An Example of Application of PyHasse
In the following sections the application of both PyHasse software packages is
demonstrated. We apply both variants of PyHasse to the generation of a Hasse
diagram of eight Rhine regions, which are characterized by 4 indicators, describing
the pollution of the herb layer by lead, cadmium, zinc and sulfur (in mg/kg dry
mass). These indicators are denoted by the chemical symbols, i.e. Pb, Cd, Zn and
S. The idea behind this monitoring study by the environmental protection agency
of Baden-Württemberg [ . . . ] (in the following often abbreviated as “bawue”) is to
identify transport mechanisms.
4.1 Data Matrix
The basic assumption is a complete data matrix. Here the eight regions are
characterized by the pollution of the herb layer by four indicators, therefore the
data matrix has 8 rows (for the objects) and 4 columns (for the indicators). For
application in PyHasse-conventional it is urgently required that the (0,0)-position
is filled with a (dummy) text. Therefore the typical data matrix, suitable for both
packages looks, as shown in Fig. 1.
The text “bawueks” is located in the (0,0)-position of the matrix. It is a good
idea to use the “dummy” text for a brief information about the data matrix.
bawueks
Pb
Cd
Zn
S
01
1
0,04
21
1540
10
1
0,03
29
1780
24
1,7
0,18
39
1740
31
1,1
0,15
28
1740
19
0,8
0,01
18
4030
43
0,5
0,11
39
4030
52
2
0,23
36
4030
56
1
0,11
34
1970
Fig. 1 data matrix, see text, ks stands for German “Krautschicht” (“herblayer”)