

Deep Ranking Analysis by Power Eigenvectors (DRAPE): A Study. . .
287
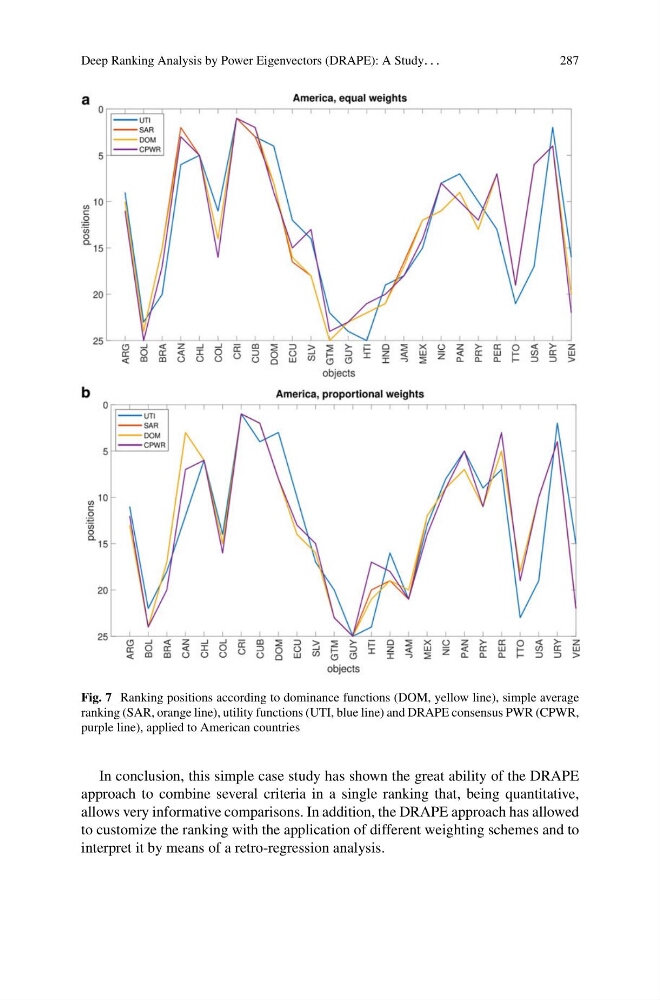
Fig. 7 Ranking positions according to dominance functions (DOM, yellow line), simple average
ranking (SAR, orange line), utility functions (UTI, blue line) and DRAPE consensus PWR (CPWR,
purple line), applied to American countries
In conclusion, this simple case study has shown the great ability of the DRAPE
approach to combine several criteria in a single ranking that, being quantitative,
allows very informative comparisons. In addition, the DRAPE approach has allowed
to customize the ranking with the application of different weighting schemes and to
interpret it by means of a retro-regression analysis.
287
Fig. 7 Ranking positions according to dominance functions (DOM, yellow line), simple average
ranking (SAR, orange line), utility functions (UTI, blue line) and DRAPE consensus PWR (CPWR,
purple line), applied to American countries
In conclusion, this simple case study has shown the great ability of the DRAPE
approach to combine several criteria in a single ranking that, being quantitative,
allows very informative comparisons. In addition, the DRAPE approach has allowed
to customize the ranking with the application of different weighting schemes and to
interpret it by means of a retro-regression analysis.