

250
L. S. Alaimo and P. Conigliaro
4 Exploratory Data Analysis
The first step in our analysis has been the exploratory analysis concerning the
bivariate relationships between the variables of well-being. In order to test the
existence and the strength of linear relationships among the seven variables of
SWB considered, we calculate the correlation coefficients (Kendall’s Tau-b) 13 . A
high correlation coefficient would indicate a potential high internal consistency
between dimensions, which should allow us to reduce the set of items. As can be
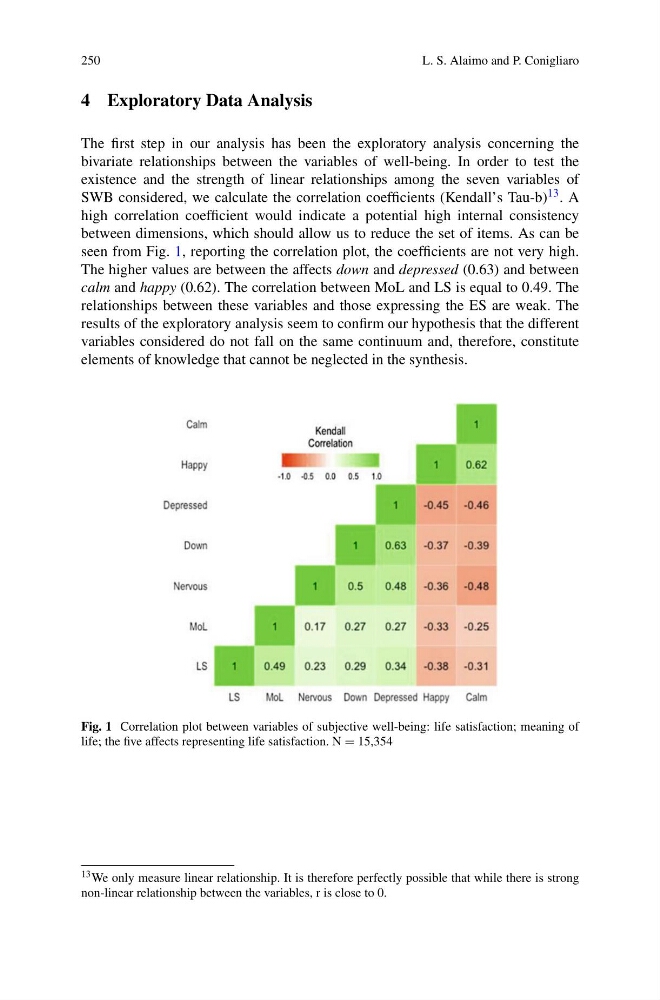
seen from Fig. 1, reporting the correlation plot, the coefficients are not very high.
The higher values are between the affects down and depressed (0.63) and between
calm and happy (0.62). The correlation between MoL and LS is equal to 0.49. The
relationships between these variables and those expressing the ES are weak. The
results of the exploratory analysis seem to confirm our hypothesis that the different
variables considered do not fall on the same continuum and, therefore, constitute
elements of knowledge that cannot be neglected in the synthesis.
Fig. 1 Correlation plot between variables of subjective well-being: life satisfaction; meaning of
life; the five affects representing life satisfaction. N = 15,354
13 We only measure linear relationship. It is therefore perfectly possible that while there is strong
non-linear relationship between the variables, r is close to 0.
L. S. Alaimo and P. Conigliaro
4 Exploratory Data Analysis
The first step in our analysis has been the exploratory analysis concerning the
bivariate relationships between the variables of well-being. In order to test the
existence and the strength of linear relationships among the seven variables of
SWB considered, we calculate the correlation coefficients (Kendall’s Tau-b) 13 . A
high correlation coefficient would indicate a potential high internal consistency
between dimensions, which should allow us to reduce the set of items. As can be
seen from Fig. 1, reporting the correlation plot, the coefficients are not very high.
The higher values are between the affects down and depressed (0.63) and between
calm and happy (0.62). The correlation between MoL and LS is equal to 0.49. The
relationships between these variables and those expressing the ES are weak. The
results of the exploratory analysis seem to confirm our hypothesis that the different
variables considered do not fall on the same continuum and, therefore, constitute
elements of knowledge that cannot be neglected in the synthesis.
Fig. 1 Correlation plot between variables of subjective well-being: life satisfaction; meaning of
life; the five affects representing life satisfaction. N = 15,354
13 We only measure linear relationship. It is therefore perfectly possible that while there is strong
non-linear relationship between the variables, r is close to 0.