

132
G. Al-Sharrah and H. M. S. Lababidi
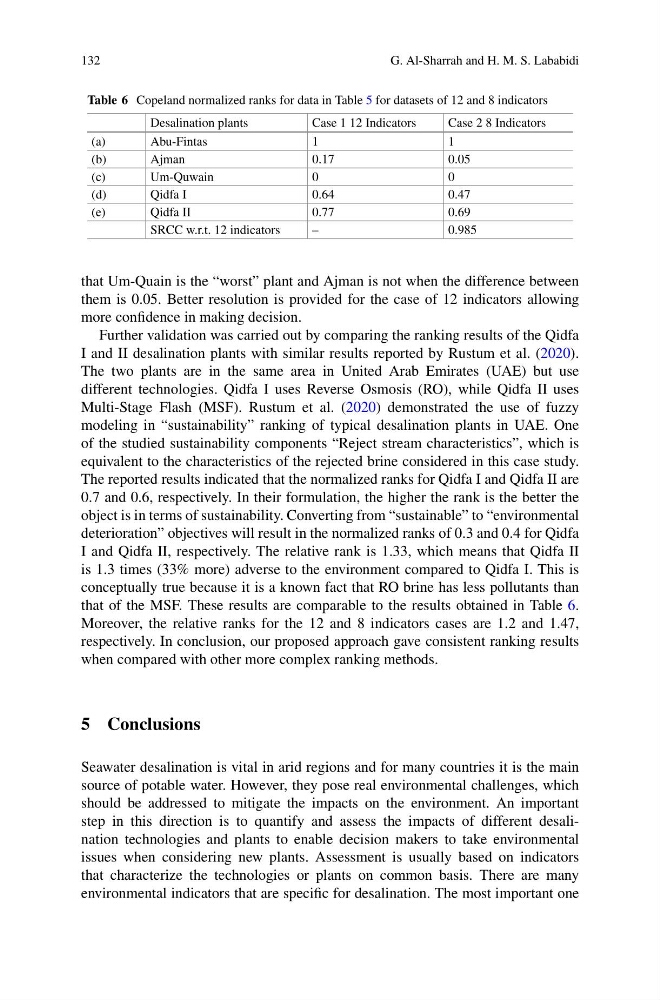
Table 6 Copeland normalized ranks for data in Table 5 for datasets of 12 and 8 indicators
Desalination plants
Case 1 12 Indicators
Case 2 8 Indicators
(a)
Abu-Fintas
1
1
(b)
Ajman
0.17
0.05
(c)
Um-Quwain
0
0
(d)
Qidfa I
0.64
0.47
(e)
Qidfa II
0.77
0.69
SRCC w.r.t. 12 indicators
–
0.985
that Um-Quain is the “worst” plant and Ajman is not when the difference between
them is 0.05. Better resolution is provided for the case of 12 indicators allowing
more confidence in making decision.
Further validation was carried out by comparing the ranking results of the Qidfa
I and II desalination plants with similar results reported by Rustum et al. (2020).
The two plants are in the same area in United Arab Emirates (UAE) but use
different technologies. Qidfa I uses Reverse Osmosis (RO), while Qidfa II uses
Multi-Stage Flash (MSF). Rustum et al. (2020) demonstrated the use of fuzzy
modeling in “sustainability” ranking of typical desalination plants in UAE. One
of the studied sustainability components “Reject stream characteristics”, which is
equivalent to the characteristics of the rejected brine considered in this case study.
The reported results indicated that the normalized ranks for Qidfa I and Qidfa II are
0.7 and 0.6, respectively. In their formulation, the higher the rank is the better the
object is in terms of sustainability. Converting from “sustainable” to “environmental
deterioration” objectives will result in the normalized ranks of 0.3 and 0.4 for Qidfa
I and Qidfa II, respectively. The relative rank is 1.33, which means that Qidfa II
is 1.3 times (33% more) adverse to the environment compared to Qidfa I. This is
conceptually true because it is a known fact that RO brine has less pollutants than
that of the MSF. These results are comparable to the results obtained in Table 6.
Moreover, the relative ranks for the 12 and 8 indicators cases are 1.2 and 1.47,
respectively. In conclusion, our proposed approach gave consistent ranking results
when compared with other more complex ranking methods.
5 Conclusions
Seawater desalination is vital in arid regions and for many countries it is the main
source of potable water. However, they pose real environmental challenges, which
should be addressed to mitigate the impacts on the environment. An important
step in this direction is to quantify and assess the impacts of different desalination technologies and plants to enable decision makers to take environmental
issues when considering new plants. Assessment is usually based on indicators
that characterize the technologies or plants on common basis. There are many
environmental indicators that are specific for desalination. The most important one
G. Al-Sharrah and H. M. S. Lababidi
Table 6 Copeland normalized ranks for data in Table 5 for datasets of 12 and 8 indicators
Desalination plants
Case 1 12 Indicators
Case 2 8 Indicators
(a)
Abu-Fintas
1
1
(b)
Ajman
0.17
0.05
(c)
Um-Quwain
0
0
(d)
Qidfa I
0.64
0.47
(e)
Qidfa II
0.77
0.69
SRCC w.r.t. 12 indicators
–
0.985
that Um-Quain is the “worst” plant and Ajman is not when the difference between
them is 0.05. Better resolution is provided for the case of 12 indicators allowing
more confidence in making decision.
Further validation was carried out by comparing the ranking results of the Qidfa
I and II desalination plants with similar results reported by Rustum et al. (2020).
The two plants are in the same area in United Arab Emirates (UAE) but use
different technologies. Qidfa I uses Reverse Osmosis (RO), while Qidfa II uses
Multi-Stage Flash (MSF). Rustum et al. (2020) demonstrated the use of fuzzy
modeling in “sustainability” ranking of typical desalination plants in UAE. One
of the studied sustainability components “Reject stream characteristics”, which is
equivalent to the characteristics of the rejected brine considered in this case study.
The reported results indicated that the normalized ranks for Qidfa I and Qidfa II are
0.7 and 0.6, respectively. In their formulation, the higher the rank is the better the
object is in terms of sustainability. Converting from “sustainable” to “environmental
deterioration” objectives will result in the normalized ranks of 0.3 and 0.4 for Qidfa
I and Qidfa II, respectively. The relative rank is 1.33, which means that Qidfa II
is 1.3 times (33% more) adverse to the environment compared to Qidfa I. This is
conceptually true because it is a known fact that RO brine has less pollutants than
that of the MSF. These results are comparable to the results obtained in Table 6.
Moreover, the relative ranks for the 12 and 8 indicators cases are 1.2 and 1.47,
respectively. In conclusion, our proposed approach gave consistent ranking results
when compared with other more complex ranking methods.
5 Conclusions
Seawater desalination is vital in arid regions and for many countries it is the main
source of potable water. However, they pose real environmental challenges, which
should be addressed to mitigate the impacts on the environment. An important
step in this direction is to quantify and assess the impacts of different desalination technologies and plants to enable decision makers to take environmental
issues when considering new plants. Assessment is usually based on indicators
that characterize the technologies or plants on common basis. There are many
environmental indicators that are specific for desalination. The most important one