

120
G. Al-Sharrah and H. M. S. Lababidi
and redundant ones. For this reason, it is important to study the relationships
between indicators and their expected impacts on the final decisions.
In general, most of the indicators are in some way or another related to other
properties. Values of indicators are normally measured using online sensors or
determined by chemical Lab analysis of collected samples. In many occasions, Lab
analyses are also necessary to calibrate the sensors. Moreover, most of the indicators
are related to one or more physical or chemical properties. The relationship between
the indicator and its related properties may be expressed in the form of simple
equation derived from basic principles. In many cases, this relationship is correlated
using experimental data. For both cases, the relationship between the indicator and
other variables and parameters is referred to as a “model”. The output of the model is
basically the value of the indicator, while the inputs to the model are the dependent
variables, which are usually known as “primary variables”.
A “dependent indicator” is an indicator that is correlated to other indicators
or to primary variables. The correlations are expressed as models, which are
mathematical formulations that describe how the value of the dependent indicators
change with changes in their corresponding variables. Methods for developing the
correlations (models) are generally classified as statistical and conceptual. Statistical
methods are basically applied to numerical data and result in correlations described
as simple to use formulations (Imam et al. 1993). Conceptual methods are oriented
towards qualitative data and rules. Environmental assessments can benefit from
the correlations that may exist among indicators (Sutherland et al. 2016). These
correlations are also known as dependencies.
Examples of reported dependencies between environmental indicators include
the correlation between dissolved oxygen and pH (Makkaveev 2009), CO 2 emission
and energy consumption (Omri 2013) and the watershed indicator that relates
percentages of old forest to interior forest (Sutherland et al. 2016). Dependent
environmental indicators can be modeled as linear, multiple-linear or simple nonlinear models (Piegorsch and Bailer 2005). In an attempt to rank chemicals
according to their hazardous effects (such as threshold limit value or lethal dose),
Al-Sharrah (2011) defined the dependency between the indicator Y 1 and another two
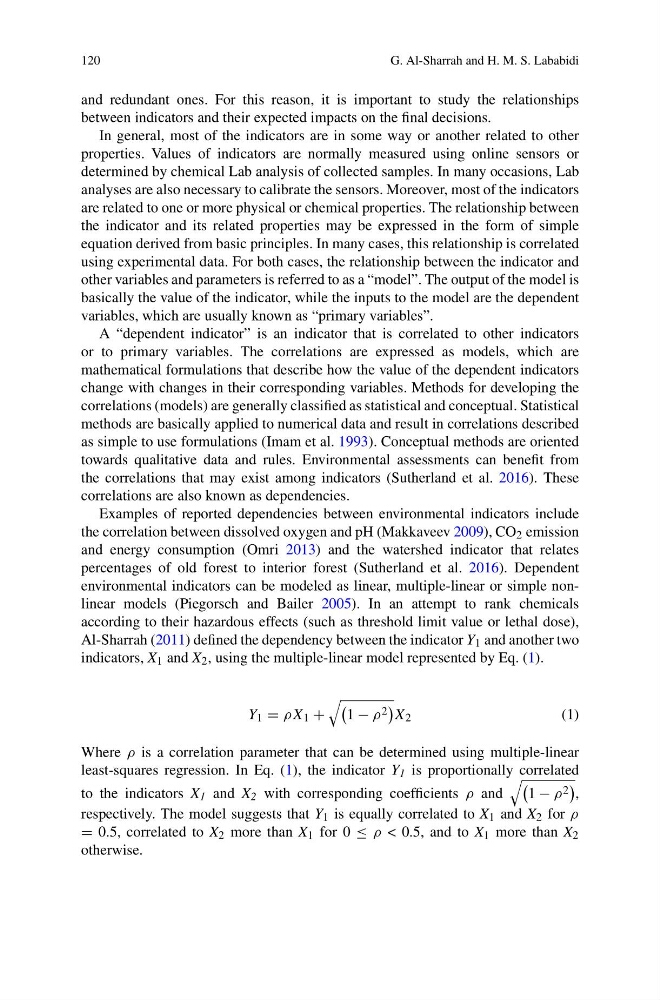
indicators, X 1 and X 2 , using the multiple-linear model represented by Eq. (1).
Y 1 = ρX 1 +
1 − ρ 2
X 2
(1)
Where ρ is a correlation parameter that can be determined using multiple-linear
least-squares regression. In Eq. (1), the indicator Y 1 is proportionally correlated
to the indicators X 1 and X 2 with corresponding coefficients ρ and
1 − ρ 2
,
respectively. The model suggests that Y 1 is equally correlated to X 1 and X 2 for ρ
= 0.5, correlated to X 2 more than X 1 for 0 ≤ ρ < 0.5, and to X 1 more than X 2
otherwise.
G. Al-Sharrah and H. M. S. Lababidi
and redundant ones. For this reason, it is important to study the relationships
between indicators and their expected impacts on the final decisions.
In general, most of the indicators are in some way or another related to other
properties. Values of indicators are normally measured using online sensors or
determined by chemical Lab analysis of collected samples. In many occasions, Lab
analyses are also necessary to calibrate the sensors. Moreover, most of the indicators
are related to one or more physical or chemical properties. The relationship between
the indicator and its related properties may be expressed in the form of simple
equation derived from basic principles. In many cases, this relationship is correlated
using experimental data. For both cases, the relationship between the indicator and
other variables and parameters is referred to as a “model”. The output of the model is
basically the value of the indicator, while the inputs to the model are the dependent
variables, which are usually known as “primary variables”.
A “dependent indicator” is an indicator that is correlated to other indicators
or to primary variables. The correlations are expressed as models, which are
mathematical formulations that describe how the value of the dependent indicators
change with changes in their corresponding variables. Methods for developing the
correlations (models) are generally classified as statistical and conceptual. Statistical
methods are basically applied to numerical data and result in correlations described
as simple to use formulations (Imam et al. 1993). Conceptual methods are oriented
towards qualitative data and rules. Environmental assessments can benefit from
the correlations that may exist among indicators (Sutherland et al. 2016). These
correlations are also known as dependencies.
Examples of reported dependencies between environmental indicators include
the correlation between dissolved oxygen and pH (Makkaveev 2009), CO 2 emission
and energy consumption (Omri 2013) and the watershed indicator that relates
percentages of old forest to interior forest (Sutherland et al. 2016). Dependent
environmental indicators can be modeled as linear, multiple-linear or simple nonlinear models (Piegorsch and Bailer 2005). In an attempt to rank chemicals
according to their hazardous effects (such as threshold limit value or lethal dose),
Al-Sharrah (2011) defined the dependency between the indicator Y 1 and another two
indicators, X 1 and X 2 , using the multiple-linear model represented by Eq. (1).
Y 1 = ρX 1 +
1 − ρ 2
X 2
(1)
Where ρ is a correlation parameter that can be determined using multiple-linear
least-squares regression. In Eq. (1), the indicator Y 1 is proportionally correlated
to the indicators X 1 and X 2 with corresponding coefficients ρ and
1 − ρ 2
,
respectively. The model suggests that Y 1 is equally correlated to X 1 and X 2 for ρ
= 0.5, correlated to X 2 more than X 1 for 0 ≤ ρ < 0.5, and to X 1 more than X 2
otherwise.