

1.6. THE SECOND DERIVATIVE
63
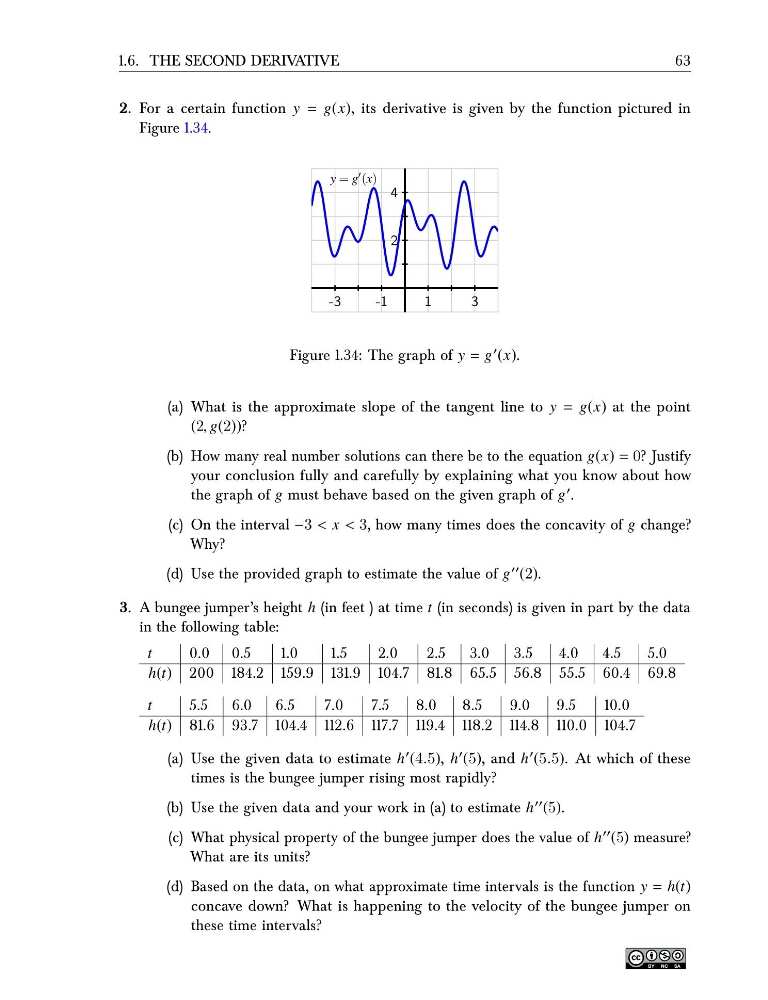
2. For a certain function y = g(x), its derivative is given by the function pictured in
Figure 1.34.
-3
-1
1
3
2
4
y = g ′ (x)
Figure 1.34: The graph of y = g ′ (x).
(a) What is the approximate slope of the tangent line to y = g(x) at the point
(2, g(2))?
(b) How many real number solutions can there be to the equation g(x) = 0? Justify
your conclusion fully and carefully by explaining what you know about how
the graph of g must behave based on the given graph of g ′ .
(c) On the interval −3 < x < 3, how many times does the concavity of g change?
Why?
(d) Use the provided graph to estimate the value of g ′′ (2).
3. A bungee jumper’s height h (in feet ) at time t (in seconds) is given in part by the data
in the following table:
t
0.0 0.5
1.0
1.5
2.0
2.5
3.0
3.5
4.0
4.5
5.0
h(t) 200 184.2 159.9 131.9 104.7 81.8 65.5 56.8 55.5 60.4 69.8
t
5.5
6.0 6.5
7.0
7.5
8.0
8.5
9.0
9.5
10.0
h(t) 81.6 93.7 104.4 112.6 117.7 119.4 118.2 114.8 110.0 104.7
(a) Use the given data to estimate h ′ (4.5), h ′ (5), and h ′ (5.5). At which of these
times is the bungee jumper rising most rapidly?
(b) Use the given data and your work in (a) to estimate h ′′ (5).
(c) What physical property of the bungee jumper does the value of h ′′ (5) measure?
What are its units?
(d) Based on the data, on what approximate time intervals is the function y = h(t)
concave down? What is happening to the velocity of the bungee jumper on
these time intervals?
63
2. For a certain function y = g(x), its derivative is given by the function pictured in
Figure 1.34.
-3
-1
1
3
2
4
y = g ′ (x)
Figure 1.34: The graph of y = g ′ (x).
(a) What is the approximate slope of the tangent line to y = g(x) at the point
(2, g(2))?
(b) How many real number solutions can there be to the equation g(x) = 0? Justify
your conclusion fully and carefully by explaining what you know about how
the graph of g must behave based on the given graph of g ′ .
(c) On the interval −3 < x < 3, how many times does the concavity of g change?
Why?
(d) Use the provided graph to estimate the value of g ′′ (2).
3. A bungee jumper’s height h (in feet ) at time t (in seconds) is given in part by the data
in the following table:
t
0.0 0.5
1.0
1.5
2.0
2.5
3.0
3.5
4.0
4.5
5.0
h(t) 200 184.2 159.9 131.9 104.7 81.8 65.5 56.8 55.5 60.4 69.8
t
5.5
6.0 6.5
7.0
7.5
8.0
8.5
9.0
9.5
10.0
h(t) 81.6 93.7 104.4 112.6 117.7 119.4 118.2 114.8 110.0 104.7
(a) Use the given data to estimate h ′ (4.5), h ′ (5), and h ′ (5.5). At which of these
times is the bungee jumper rising most rapidly?
(b) Use the given data and your work in (a) to estimate h ′′ (5).
(c) What physical property of the bungee jumper does the value of h ′′ (5) measure?
What are its units?
(d) Based on the data, on what approximate time intervals is the function y = h(t)
concave down? What is happening to the velocity of the bungee jumper on
these time intervals?