

1.6. THE SECOND DERIVATIVE
57
Figure 1.29: Three functions that are all increasing, but doing so at an increasing rate, at a
constant rate, and at a decreasing rate, respectively.
“−100 is more negative than −2.” This leads us to note particularly that when a function’s
values are negative, and those values subsequently get more negative, the function must
be decreasing.
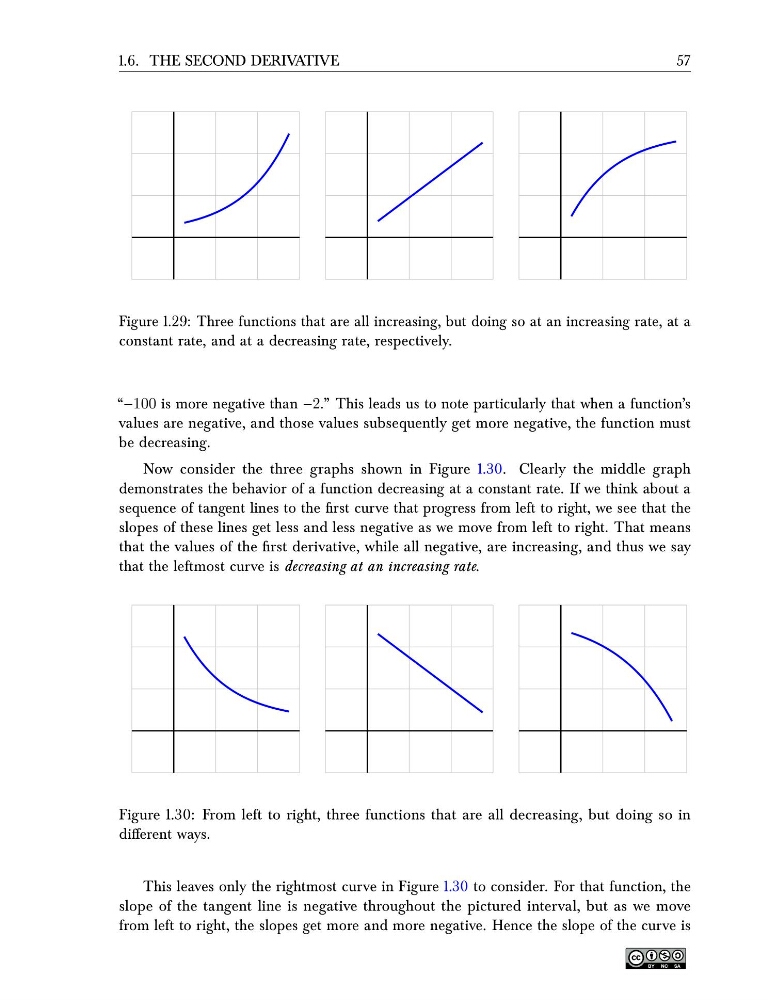
Now consider the three graphs shown in Figure 1.30. Clearly the middle graph
demonstrates the behavior of a function decreasing at a constant rate. If we think about a
sequence of tangent lines to the first curve that progress from left to right, we see that the
slopes of these lines get less and less negative as we move from left to right. That means
that the values of the first derivative, while all negative, are increasing, and thus we say
that the leftmost curve is decreasing at an increasing rate.
Figure 1.30: From left to right, three functions that are all decreasing, but doing so in
different ways.
This leaves only the rightmost curve in Figure 1.30 to consider. For that function, the
slope of the tangent line is negative throughout the pictured interval, but as we move
from left to right, the slopes get more and more negative. Hence the slope of the curve is
57
Figure 1.29: Three functions that are all increasing, but doing so at an increasing rate, at a
constant rate, and at a decreasing rate, respectively.
“−100 is more negative than −2.” This leads us to note particularly that when a function’s
values are negative, and those values subsequently get more negative, the function must
be decreasing.
Now consider the three graphs shown in Figure 1.30. Clearly the middle graph
demonstrates the behavior of a function decreasing at a constant rate. If we think about a
sequence of tangent lines to the first curve that progress from left to right, we see that the
slopes of these lines get less and less negative as we move from left to right. That means
that the values of the first derivative, while all negative, are increasing, and thus we say
that the leftmost curve is decreasing at an increasing rate.
Figure 1.30: From left to right, three functions that are all decreasing, but doing so in
different ways.
This leaves only the rightmost curve in Figure 1.30 to consider. For that function, the
slope of the tangent line is negative throughout the pictured interval, but as we move
from left to right, the slopes get more and more negative. Hence the slope of the curve is