

1.3. THE DERIVATIVE OF A FUNCTION AT A POINT
31
• the secant line to y = f (x) on the interval [−3, −1] and the secant line to
y = f (x) on the interval [0, 2].
• the tangent line to y = f (x) at x = −3 and the tangent line to y = f (x) at
x = 0.
-4
4
-4
4
x
y
f
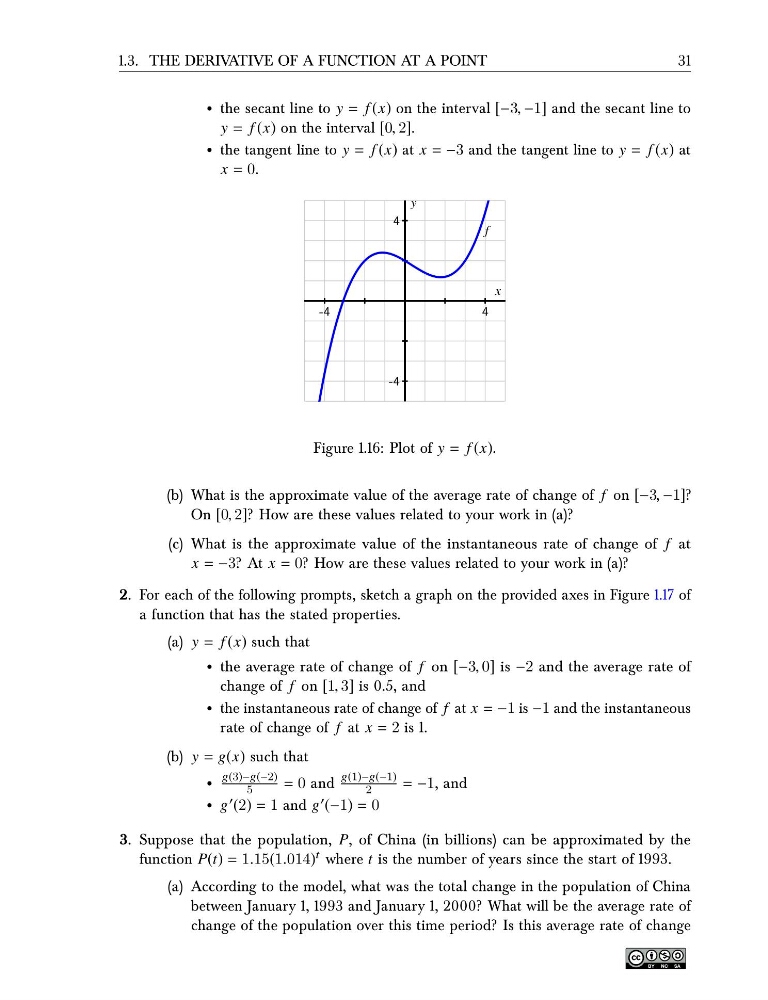
Figure 1.16: Plot of y = f (x).
(b) What is the approximate value of the average rate of change of f on [−3, −1]?
On [0, 2]? How are these values related to your work in (a)?
(c) What is the approximate value of the instantaneous rate of change of f at
x = −3? At x = 0? How are these values related to your work in (a)?
2. For each of the following prompts, sketch a graph on the provided axes in Figure 1.17 of
a function that has the stated properties.
(a) y = f (x) such that
• the average rate of change of f on [−3, 0] is −2 and the average rate of
change of f on [1, 3] is 0.5, and
• the instantaneous rate of change of f at x = −1 is −1 and the instantaneous
rate of change of f at x = 2 is 1.
(b) y = g(x) such that
•
g(3)−g(−2)
5
= 0 and
g(1)−g(−1)
2
= −1, and
• g ′ (2) = 1 and g ′ (−1) = 0
3. Suppose that the population, P, of China (in billions) can be approximated by the
function P(t) = 1.15(1.014) t where t is the number of years since the start of 1993.
(a) According to the model, what was the total change in the population of China
between January 1, 1993 and January 1, 2000? What will be the average rate of
change of the population over this time period? Is this average rate of change
31
• the secant line to y = f (x) on the interval [−3, −1] and the secant line to
y = f (x) on the interval [0, 2].
• the tangent line to y = f (x) at x = −3 and the tangent line to y = f (x) at
x = 0.
-4
4
-4
4
x
y
f
Figure 1.16: Plot of y = f (x).
(b) What is the approximate value of the average rate of change of f on [−3, −1]?
On [0, 2]? How are these values related to your work in (a)?
(c) What is the approximate value of the instantaneous rate of change of f at
x = −3? At x = 0? How are these values related to your work in (a)?
2. For each of the following prompts, sketch a graph on the provided axes in Figure 1.17 of
a function that has the stated properties.
(a) y = f (x) such that
• the average rate of change of f on [−3, 0] is −2 and the average rate of
change of f on [1, 3] is 0.5, and
• the instantaneous rate of change of f at x = −1 is −1 and the instantaneous
rate of change of f at x = 2 is 1.
(b) y = g(x) such that
•
g(3)−g(−2)
5
= 0 and
g(1)−g(−1)
2
= −1, and
• g ′ (2) = 1 and g ′ (−1) = 0
3. Suppose that the population, P, of China (in billions) can be approximated by the
function P(t) = 1.15(1.014) t where t is the number of years since the start of 1993.
(a) According to the model, what was the total change in the population of China
between January 1, 1993 and January 1, 2000? What will be the average rate of
change of the population over this time period? Is this average rate of change