

20
1.2. THE NOTION OF LIMIT
(c) Evaluate lim x→2 g(x) exactly, if the limit exists, or explain how your work shows
the limit fails to exist. Here you should use the definition of the absolute value
function in the numerator of g(x) as you work to evaluate the limit. Discuss
how your findings compare to your results in (b). (Hint: |a| = a whenever
a ≥ 0, but |a| = −a whenever a < 0.)
(d) True or false: g(−3) = −1. Why?
(e) True or false: −
|x+3|
x+3 = −1. Why? How is this equality connected to your work
above with the function g?
(f) Based on all of your work above, construct an accurate, labeled graph of
y = g(x) on the interval [−4, −2], and write a sentence that explains what you
now know about lim
x→−3
g(x).
3. For each of the following prompts, sketch a graph on the provided axes of a function
that has the stated properties.
-3
3
-3
3
-3
3
-3
3
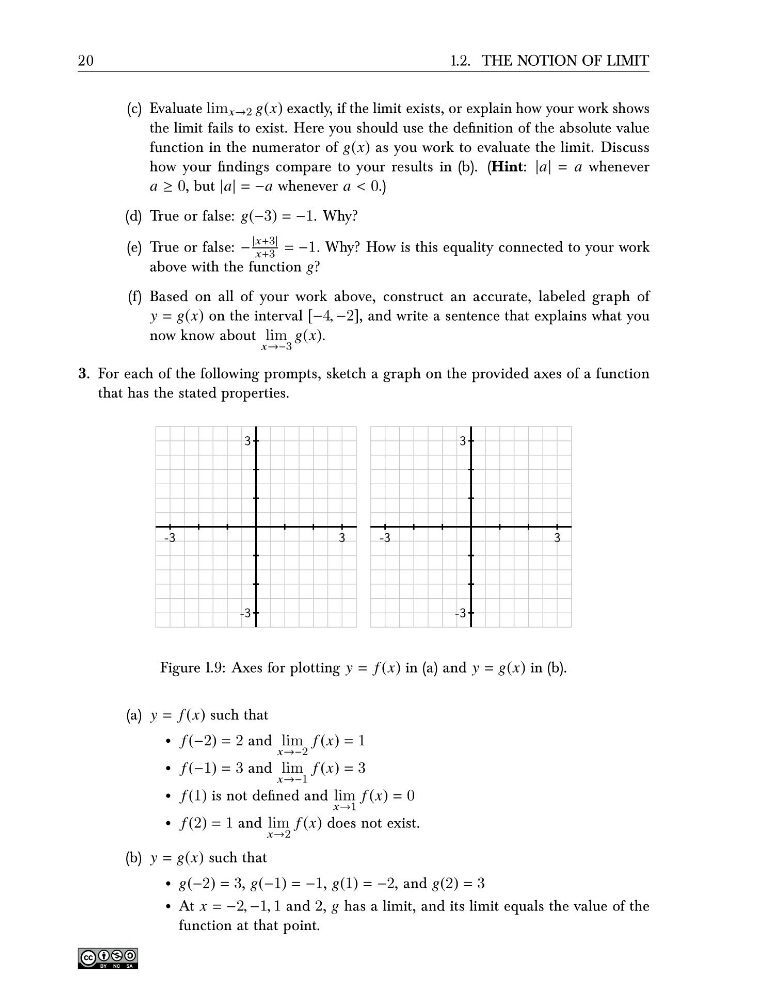
Figure 1.9: Axes for plotting y = f (x) in (a) and y = g(x) in (b).
(a) y = f (x) such that
• f (−2) = 2 and lim
x→−2
f (x) = 1
• f (−1) = 3 and lim
x→−1
f (x) = 3
• f (1) is not defined and lim
x→1
f (x) = 0
• f (2) = 1 and lim
x→2
f (x) does not exist.
(b) y = g(x) such that
• g(−2) = 3, g(−1) = −1, g(1) = −2, and g(2) = 3
• At x = −2, −1, 1 and 2, g has a limit, and its limit equals the value of the
function at that point.
1.2. THE NOTION OF LIMIT
(c) Evaluate lim x→2 g(x) exactly, if the limit exists, or explain how your work shows
the limit fails to exist. Here you should use the definition of the absolute value
function in the numerator of g(x) as you work to evaluate the limit. Discuss
how your findings compare to your results in (b). (Hint: |a| = a whenever
a ≥ 0, but |a| = −a whenever a < 0.)
(d) True or false: g(−3) = −1. Why?
(e) True or false: −
|x+3|
x+3 = −1. Why? How is this equality connected to your work
above with the function g?
(f) Based on all of your work above, construct an accurate, labeled graph of
y = g(x) on the interval [−4, −2], and write a sentence that explains what you
now know about lim
x→−3
g(x).
3. For each of the following prompts, sketch a graph on the provided axes of a function
that has the stated properties.
-3
3
-3
3
-3
3
-3
3
Figure 1.9: Axes for plotting y = f (x) in (a) and y = g(x) in (b).
(a) y = f (x) such that
• f (−2) = 2 and lim
x→−2
f (x) = 1
• f (−1) = 3 and lim
x→−1
f (x) = 3
• f (1) is not defined and lim
x→1
f (x) = 0
• f (2) = 1 and lim
x→2
f (x) does not exist.
(b) y = g(x) such that
• g(−2) = 3, g(−1) = −1, g(1) = −2, and g(2) = 3
• At x = −2, −1, 1 and 2, g has a limit, and its limit equals the value of the
function at that point.