

18.4 Water Resources
419
0
5
10
15
20
25
30
1950
1960
1970
1980
1990
2000
2010
South Rivers of Hai
North Rivers of Hai
Year
billion
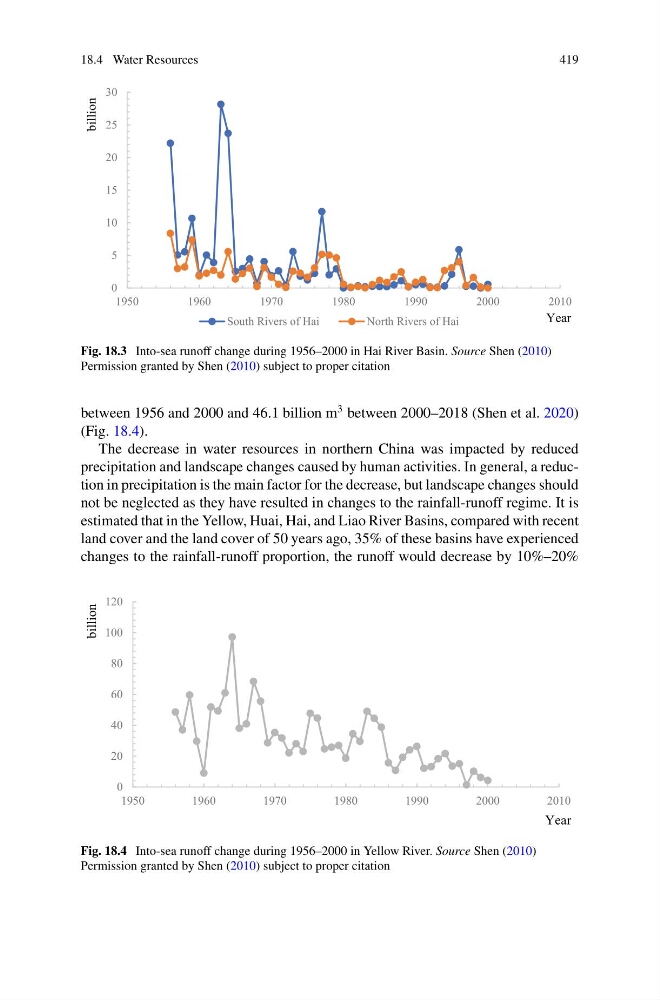
Fig. 18.3 Into-sea runoff change during 1956–2000 in Hai River Basin. Source Shen (2010)
Permission granted by Shen (2010) subject to proper citation
between 1956 and 2000 and 46.1 billion m
3 between 2000–2018 (Shen et al. 2020)
(Fig. 18.4).
The decrease in water resources in northern China was impacted by reduced
precipitation and landscape changes caused by human activities. In general, a reduction in precipitation is the main factor for the decrease, but landscape changes should
not be neglected as they have resulted in changes to the rainfall-runoff regime. It is
estimated that in the Yellow, Huai, Hai, and Liao River Basins, compared with recent
land cover and the land cover of 50 years ago, 35% of these basins have experienced
changes to the rainfall-runoff proportion, the runoff would decrease by 10%–20%
0
20
40
60
80
100
120
1950
1960
1970
1980
1990
2000
2010
Year
billion
Fig. 18.4 Into-sea runoff change during 1956–2000 in Yellow River. Source Shen (2010)
Permission granted by Shen (2010) subject to proper citation
419
0
5
10
15
20
25
30
1950
1960
1970
1980
1990
2000
2010
South Rivers of Hai
North Rivers of Hai
Year
billion
Fig. 18.3 Into-sea runoff change during 1956–2000 in Hai River Basin. Source Shen (2010)
Permission granted by Shen (2010) subject to proper citation
between 1956 and 2000 and 46.1 billion m
3 between 2000–2018 (Shen et al. 2020)
(Fig. 18.4).
The decrease in water resources in northern China was impacted by reduced
precipitation and landscape changes caused by human activities. In general, a reduction in precipitation is the main factor for the decrease, but landscape changes should
not be neglected as they have resulted in changes to the rainfall-runoff regime. It is
estimated that in the Yellow, Huai, Hai, and Liao River Basins, compared with recent
land cover and the land cover of 50 years ago, 35% of these basins have experienced
changes to the rainfall-runoff proportion, the runoff would decrease by 10%–20%
0
20
40
60
80
100
120
1950
1960
1970
1980
1990
2000
2010
Year
billion
Fig. 18.4 Into-sea runoff change during 1956–2000 in Yellow River. Source Shen (2010)
Permission granted by Shen (2010) subject to proper citation