

400
17 Environmental Flow Definition and Management: A Case Study …
79.2%
81.7%
89.0%
89.8%
78.4%
81.0%
88.5%
89.5%
81.6%
83.7%
90.2%
90.2%
80.8%
89.8%
89.8%
83.0%
75.0%
77.5%
80.0%
82.5%
85.0%
87.5%
90.0%
92.5%
95.0%
L3
L4
L5
L6
Flow reporting location
Proportion of existing mean annual flow
S2
S6
S5
S10
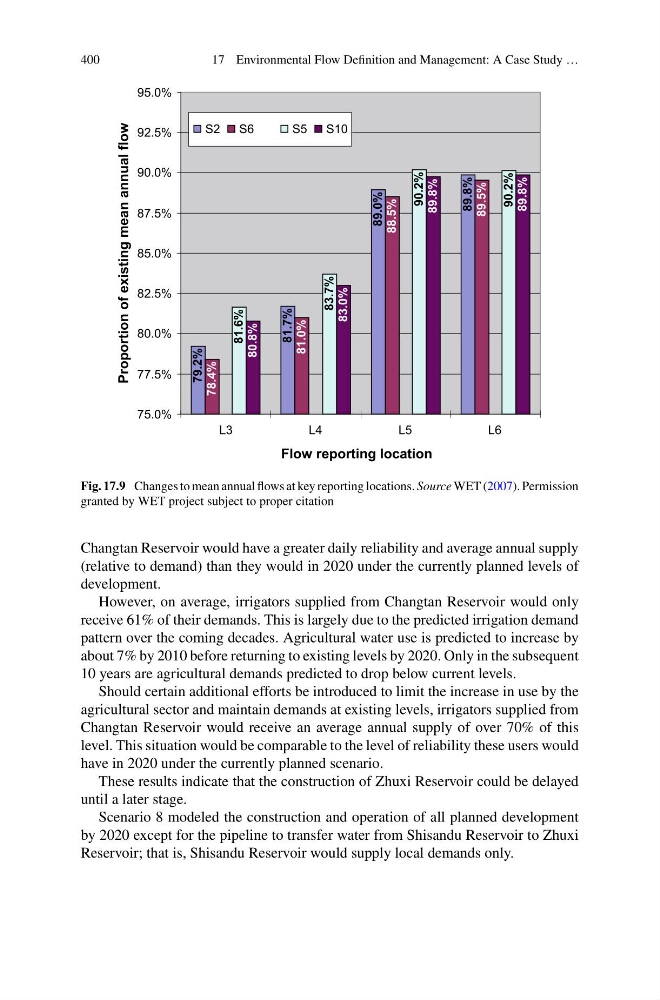
Fig. 17.9 Changes to mean annual flows at key reporting locations. Source WET (2007). Permission
granted by WET project subject to proper citation
Changtan Reservoir would have a greater daily reliability and average annual supply
(relative to demand) than they would in 2020 under the currently planned levels of
development.
However, on average, irrigators supplied from Changtan Reservoir would only
receive 61% of their demands. This is largely due to the predicted irrigation demand
pattern over the coming decades. Agricultural water use is predicted to increase by
about 7% by 2010 before returning to existing levels by 2020. Only in the subsequent
10 years are agricultural demands predicted to drop below current levels.
Should certain additional efforts be introduced to limit the increase in use by the
agricultural sector and maintain demands at existing levels, irrigators supplied from
Changtan Reservoir would receive an average annual supply of over 70% of this
level. This situation would be comparable to the level of reliability these users would
have in 2020 under the currently planned scenario.
These results indicate that the construction of Zhuxi Reservoir could be delayed
until a later stage.
Scenario 8 modeled the construction and operation of all planned development
by 2020 except for the pipeline to transfer water from Shisandu Reservoir to Zhuxi
Reservoir; that is, Shisandu Reservoir would supply local demands only.
17 Environmental Flow Definition and Management: A Case Study …
79.2%
81.7%
89.0%
89.8%
78.4%
81.0%
88.5%
89.5%
81.6%
83.7%
90.2%
90.2%
80.8%
89.8%
89.8%
83.0%
75.0%
77.5%
80.0%
82.5%
85.0%
87.5%
90.0%
92.5%
95.0%
L3
L4
L5
L6
Flow reporting location
Proportion of existing mean annual flow
S2
S6
S5
S10
Fig. 17.9 Changes to mean annual flows at key reporting locations. Source WET (2007). Permission
granted by WET project subject to proper citation
Changtan Reservoir would have a greater daily reliability and average annual supply
(relative to demand) than they would in 2020 under the currently planned levels of
development.
However, on average, irrigators supplied from Changtan Reservoir would only
receive 61% of their demands. This is largely due to the predicted irrigation demand
pattern over the coming decades. Agricultural water use is predicted to increase by
about 7% by 2010 before returning to existing levels by 2020. Only in the subsequent
10 years are agricultural demands predicted to drop below current levels.
Should certain additional efforts be introduced to limit the increase in use by the
agricultural sector and maintain demands at existing levels, irrigators supplied from
Changtan Reservoir would receive an average annual supply of over 70% of this
level. This situation would be comparable to the level of reliability these users would
have in 2020 under the currently planned scenario.
These results indicate that the construction of Zhuxi Reservoir could be delayed
until a later stage.
Scenario 8 modeled the construction and operation of all planned development
by 2020 except for the pipeline to transfer water from Shisandu Reservoir to Zhuxi
Reservoir; that is, Shisandu Reservoir would supply local demands only.