

384
17 Environmental Flow Definition and Management: A Case Study …
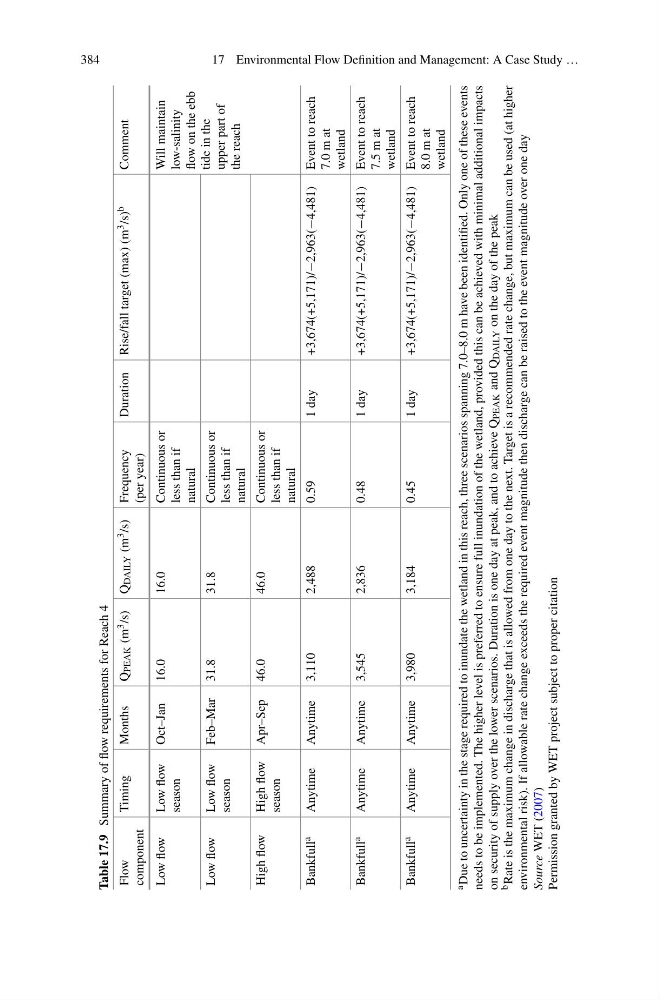
Table 17.9
Summary of flow requirements for Reach 4
Flow
component
Timing
Months
Q
PEAK (m 3
/s) Q
DAILY (m 3
/s) Frequency
(per year)
Duration Rise/fall target (max) (m 3
/s) b
Comment
Low flow
Low flow
season
Oct–Jan
16.0
16.0
Continuous or
less than if
natural
Will maintain
low-salinity
flow on the ebb
tide in the
upper part of
the reach
Low flow
Low flow
season
Feb–Mar 31.8
31.8
Continuous or
less than if
natural
High flow
High flow
season
Apr–Sep 46.0
46.0
Continuous or
less than if
natural
Bankfull a
Anytime
Anytime
3,110
2,488
0.59
1 day
+3,674(+5,171)/−2,963(−4,481) Event to reach
7.0 m at
wetland
Bankfull a
Anytime
Anytime
3,545
2,836
0.48
1 day
+3,674(+5,171)/−2,963(−4,481) Event to reach
7.5 m at
wetland
Bankfull a
Anytime
Anytime
3,980
3,184
0.45
1 day
+3,674(+5,171)/−2,963(−4,481) Event to reach
8.0 m at
wetland
a
Due to uncertainty in the stage required to inundate the wetland in this reach, three scenarios spanning 7.0–8.0 m have been identified. Only one of these events
needs to be implemented. The higher level is preferred to ensure full inundation of the wetland, provided this can be achieved with minimal additional impacts
on security of supply over the lower scenarios. Duration is one day at peak, and to achieve Q
PEAK and Q
DAILY on the day of the peak
b
Rate is the maximum change in discharge that is allowed from one day to the next. Target is a recommended rate change, but maximum can be used (at higher
environmental risk). If allowable rate change exceeds the required event magnitude then discharge can be raised to the event magnitude over one day
Source
WET (2007)
Permission granted by WET project subject to proper citation
17 Environmental Flow Definition and Management: A Case Study …
Table 17.9
Summary of flow requirements for Reach 4
Flow
component
Timing
Months
Q
PEAK (m 3
/s) Q
DAILY (m 3
/s) Frequency
(per year)
Duration Rise/fall target (max) (m 3
/s) b
Comment
Low flow
Low flow
season
Oct–Jan
16.0
16.0
Continuous or
less than if
natural
Will maintain
low-salinity
flow on the ebb
tide in the
upper part of
the reach
Low flow
Low flow
season
Feb–Mar 31.8
31.8
Continuous or
less than if
natural
High flow
High flow
season
Apr–Sep 46.0
46.0
Continuous or
less than if
natural
Bankfull a
Anytime
Anytime
3,110
2,488
0.59
1 day
+3,674(+5,171)/−2,963(−4,481) Event to reach
7.0 m at
wetland
Bankfull a
Anytime
Anytime
3,545
2,836
0.48
1 day
+3,674(+5,171)/−2,963(−4,481) Event to reach
7.5 m at
wetland
Bankfull a
Anytime
Anytime
3,980
3,184
0.45
1 day
+3,674(+5,171)/−2,963(−4,481) Event to reach
8.0 m at
wetland
a
Due to uncertainty in the stage required to inundate the wetland in this reach, three scenarios spanning 7.0–8.0 m have been identified. Only one of these events
needs to be implemented. The higher level is preferred to ensure full inundation of the wetland, provided this can be achieved with minimal additional impacts
on security of supply over the lower scenarios. Duration is one day at peak, and to achieve Q
PEAK and Q
DAILY on the day of the peak
b
Rate is the maximum change in discharge that is allowed from one day to the next. Target is a recommended rate change, but maximum can be used (at higher
environmental risk). If allowable rate change exceeds the required event magnitude then discharge can be raised to the event magnitude over one day
Source
WET (2007)
Permission granted by WET project subject to proper citation