

1.2 Hydrology
9
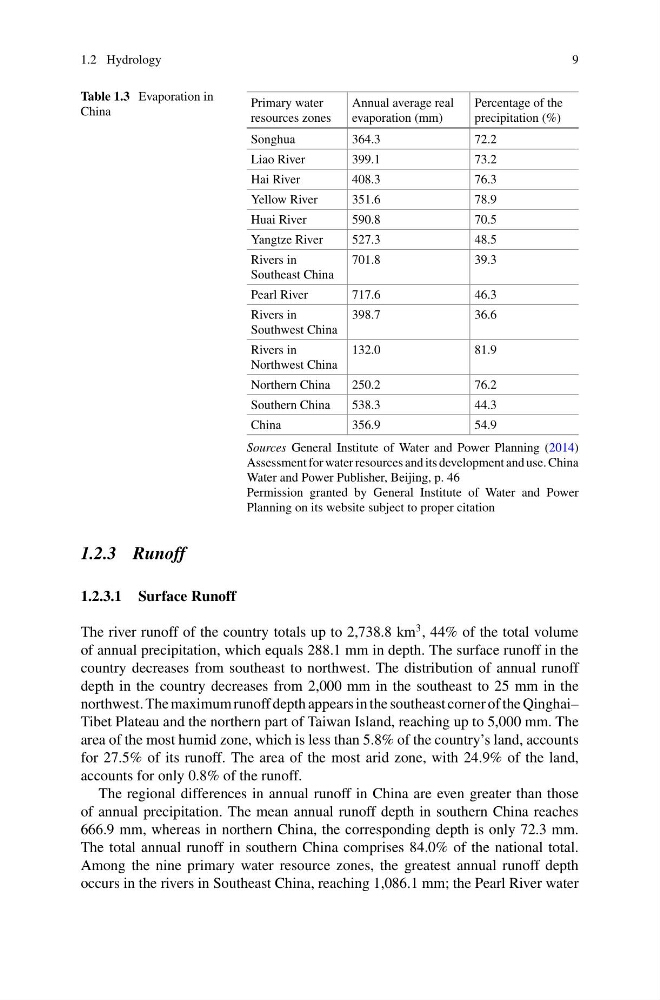
Table 1.3 Evaporation in
China
Primary water
resources zones
Annual average real
evaporation (mm)
Percentage of the
precipitation (%)
Songhua
364.3
72.2
Liao River
399.1
73.2
Hai River
408.3
76.3
Yellow River
351.6
78.9
Huai River
590.8
70.5
Yangtze River
527.3
48.5
Rivers in
Southeast China
701.8
39.3
Pearl River
717.6
46.3
Rivers in
Southwest China
398.7
36.6
Rivers in
Northwest China
132.0
81.9
Northern China
250.2
76.2
Southern China
538.3
44.3
China
356.9
54.9
Sources General Institute of Water and Power Planning (2014)
Assessment for water resources and its development and use. China
Water and Power Publisher, Beijing, p. 46
Permission granted by General Institute of Water and Power
Planning on its website subject to proper citation
1.2.3 Runoff
1.2.3.1 Surface Runoff
The river runoff of the country totals up to 2,738.8 km
3 , 44% of the total volume
of annual precipitation, which equals 288.1 mm in depth. The surface runoff in the
country decreases from southeast to northwest. The distribution of annual runoff
depth in the country decreases from 2,000 mm in the southeast to 25 mm in the
northwest. The maximum runoff depth appears in the southeast corner of the Qinghai–
Tibet Plateau and the northern part of Taiwan Island, reaching up to 5,000 mm. The
area of the most humid zone, which is less than 5.8% of the country’s land, accounts
for 27.5% of its runoff. The area of the most arid zone, with 24.9% of the land,
accounts for only 0.8% of the runoff.
The regional differences in annual runoff in China are even greater than those
of annual precipitation. The mean annual runoff depth in southern China reaches
666.9 mm, whereas in northern China, the corresponding depth is only 72.3 mm.
The total annual runoff in southern China comprises 84.0% of the national total.
Among the nine primary water resource zones, the greatest annual runoff depth
occurs in the rivers in Southeast China, reaching 1,086.1 mm; the Pearl River water
9
Table 1.3 Evaporation in
China
Primary water
resources zones
Annual average real
evaporation (mm)
Percentage of the
precipitation (%)
Songhua
364.3
72.2
Liao River
399.1
73.2
Hai River
408.3
76.3
Yellow River
351.6
78.9
Huai River
590.8
70.5
Yangtze River
527.3
48.5
Rivers in
Southeast China
701.8
39.3
Pearl River
717.6
46.3
Rivers in
Southwest China
398.7
36.6
Rivers in
Northwest China
132.0
81.9
Northern China
250.2
76.2
Southern China
538.3
44.3
China
356.9
54.9
Sources General Institute of Water and Power Planning (2014)
Assessment for water resources and its development and use. China
Water and Power Publisher, Beijing, p. 46
Permission granted by General Institute of Water and Power
Planning on its website subject to proper citation
1.2.3 Runoff
1.2.3.1 Surface Runoff
The river runoff of the country totals up to 2,738.8 km
3 , 44% of the total volume
of annual precipitation, which equals 288.1 mm in depth. The surface runoff in the
country decreases from southeast to northwest. The distribution of annual runoff
depth in the country decreases from 2,000 mm in the southeast to 25 mm in the
northwest. The maximum runoff depth appears in the southeast corner of the Qinghai–
Tibet Plateau and the northern part of Taiwan Island, reaching up to 5,000 mm. The
area of the most humid zone, which is less than 5.8% of the country’s land, accounts
for 27.5% of its runoff. The area of the most arid zone, with 24.9% of the land,
accounts for only 0.8% of the runoff.
The regional differences in annual runoff in China are even greater than those
of annual precipitation. The mean annual runoff depth in southern China reaches
666.9 mm, whereas in northern China, the corresponding depth is only 72.3 mm.
The total annual runoff in southern China comprises 84.0% of the national total.
Among the nine primary water resource zones, the greatest annual runoff depth
occurs in the rivers in Southeast China, reaching 1,086.1 mm; the Pearl River water