

224
10 Recycled Water Use Management
Table 10.1 (continued)
Year Length of
drainage
pipelines
(km)
Annual
quantity of
wastewater
discharged
(1,000,000 m 3 )
Wastewater treatment
plant
Annual
treatment
capacity
(1,000,000 m 3 )
Wastewater
treatment
rate (%)
Number
(unit)
Treatment
capacity
(1,000 m 3 /day)
2011 414,074
40,370.22
1588
113,030
33,761.04
83.63
2012 439,080
41,676.02
1670
117,330
34,378.68
87.30
2013 464,878
42,745.25
1736
124,540
38,189.48
89.34
2014 511,179
44,534.28
1807
130,870
40,161.98
90.18
2015 539,567
46,662.10
1944
140,380
42,882.51
91.90
2016 576,617
48,030.49
2039
149,100
44,879.44
93.44
2017 630,304
49,238.95
2209
157,430
46,549.10
94.54
2018 683,485
52,112.49
2321
168,810
49,761.26
95.49
Note Number of wastewater treatment plants and treatment capacity from 1978 to 1995 are limited
to the statistical figure in the urban construction sector
Sources MOHURD (2019) 2018 China urban-rural development statistical yearbook
Permission granted by MOHURD on its website subject to proper citation
0
5
10
15
20
25
30
35
40
2002 2003 2004 2005 2006 2007 2008 2009 2010 2011 2012 2013 2014 2015 2016 2017
Production Capacity (million m3/day)
volume (billion m3)
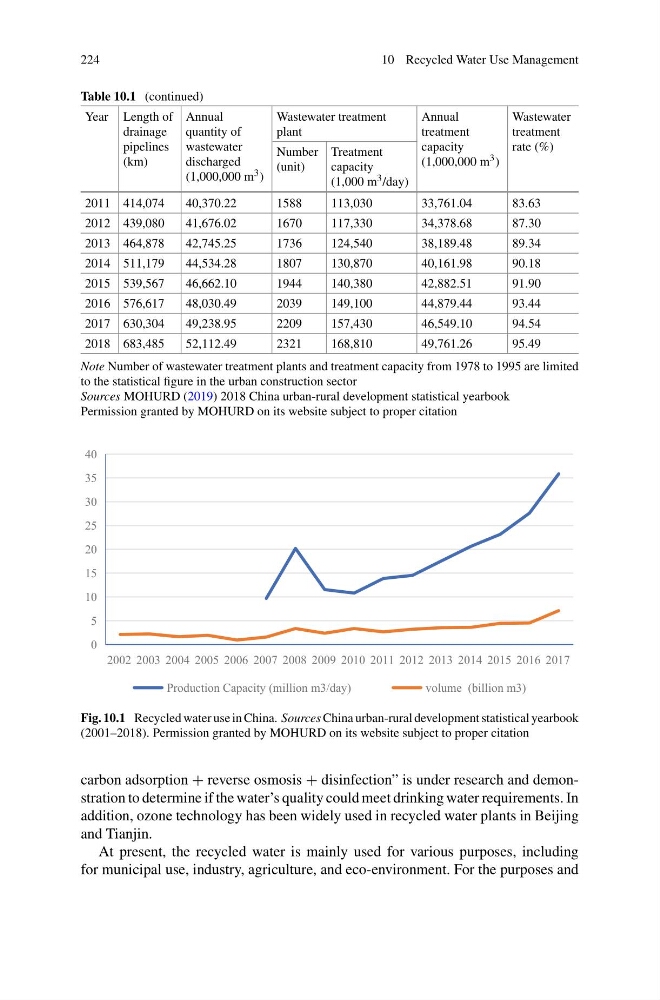
Fig. 10.1 Recycled water use in China. Sources China urban-rural development statistical yearbook
(2001–2018). Permission granted by MOHURD on its website subject to proper citation
carbon adsorption + reverse osmosis + disinfection” is under research and demonstration to determine if the water’s quality could meet drinking water requirements. In
addition, ozone technology has been widely used in recycled water plants in Beijing
and Tianjin.
At present, the recycled water is mainly used for various purposes, including
for municipal use, industry, agriculture, and eco-environment. For the purposes and
10 Recycled Water Use Management
Table 10.1 (continued)
Year Length of
drainage
pipelines
(km)
Annual
quantity of
wastewater
discharged
(1,000,000 m 3 )
Wastewater treatment
plant
Annual
treatment
capacity
(1,000,000 m 3 )
Wastewater
treatment
rate (%)
Number
(unit)
Treatment
capacity
(1,000 m 3 /day)
2011 414,074
40,370.22
1588
113,030
33,761.04
83.63
2012 439,080
41,676.02
1670
117,330
34,378.68
87.30
2013 464,878
42,745.25
1736
124,540
38,189.48
89.34
2014 511,179
44,534.28
1807
130,870
40,161.98
90.18
2015 539,567
46,662.10
1944
140,380
42,882.51
91.90
2016 576,617
48,030.49
2039
149,100
44,879.44
93.44
2017 630,304
49,238.95
2209
157,430
46,549.10
94.54
2018 683,485
52,112.49
2321
168,810
49,761.26
95.49
Note Number of wastewater treatment plants and treatment capacity from 1978 to 1995 are limited
to the statistical figure in the urban construction sector
Sources MOHURD (2019) 2018 China urban-rural development statistical yearbook
Permission granted by MOHURD on its website subject to proper citation
0
5
10
15
20
25
30
35
40
2002 2003 2004 2005 2006 2007 2008 2009 2010 2011 2012 2013 2014 2015 2016 2017
Production Capacity (million m3/day)
volume (billion m3)
Fig. 10.1 Recycled water use in China. Sources China urban-rural development statistical yearbook
(2001–2018). Permission granted by MOHURD on its website subject to proper citation
carbon adsorption + reverse osmosis + disinfection” is under research and demonstration to determine if the water’s quality could meet drinking water requirements. In
addition, ozone technology has been widely used in recycled water plants in Beijing
and Tianjin.
At present, the recycled water is mainly used for various purposes, including
for municipal use, industry, agriculture, and eco-environment. For the purposes and