

12
Fundamentals of Corrosion
These lines extend across the diagram until the pH is sufficiently high
to facilitate the formation of hydroxides, represented by vertical lines,
thereby reducing the concentration Fe 2+ and Fe 3+ ions. The boundary is
often set arbitrarily at the concentration of these ions at 10 −6 g-ions/liter,
which is indicative of a negligible dissolution or corrosion of the metal in
the medium.
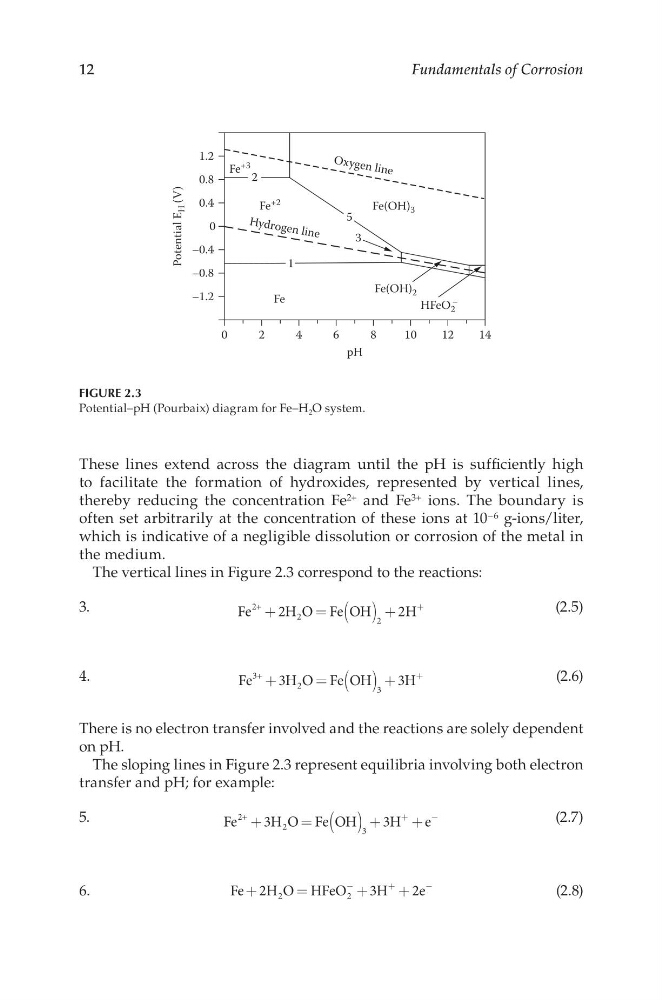
The vertical lines in Figure 2.3 correspond to the reactions:
3.
Fe
2H O Fe OH
H
2+
2
+
= ( ) +
+
2
2
(2.5)
4.
Fe
3H O Fe OH
H
3+
2
+
= ( ) +
+
3
3
(2.6)
There is no electron transfer involved and the reactions are solely dependent
on pH.
The sloping lines in Figure 2.3 represent equilibria involving both electron
transfer and pH; for example:
5.
Fe
3H O Fe OH
H
e
2+
2
+
= ( ) + +
+
−
3
3
(2.7)
6.
Fe 2H O HFeO
H
e
2
2
+
=
+
+
−
+
−
3
2
(2.8)
14
12
10
8
6
4
2
Fe
Potential E
H (V)
0
–1.2
–0.8
–0.4
0
0.4
H yd ro ge n lin e
O xy ge n lin e
0.8
1.2
Fe
+3
Fe(OH) 3
Fe(OH) 2
5
3
HFeO 2
–
Fe
+2
1
pH
2
FigurE 2.3
Potential–pH (Pourbaix) diagram for Fe–H 2 O system.
Fundamentals of Corrosion
These lines extend across the diagram until the pH is sufficiently high
to facilitate the formation of hydroxides, represented by vertical lines,
thereby reducing the concentration Fe 2+ and Fe 3+ ions. The boundary is
often set arbitrarily at the concentration of these ions at 10 −6 g-ions/liter,
which is indicative of a negligible dissolution or corrosion of the metal in
the medium.
The vertical lines in Figure 2.3 correspond to the reactions:
3.
Fe
2H O Fe OH
H
2+
2
+
= ( ) +
+
2
2
(2.5)
4.
Fe
3H O Fe OH
H
3+
2
+
= ( ) +
+
3
3
(2.6)
There is no electron transfer involved and the reactions are solely dependent
on pH.
The sloping lines in Figure 2.3 represent equilibria involving both electron
transfer and pH; for example:
5.
Fe
3H O Fe OH
H
e
2+
2
+
= ( ) + +
+
−
3
3
(2.7)
6.
Fe 2H O HFeO
H
e
2
2
+
=
+
+
−
+
−
3
2
(2.8)
14
12
10
8
6
4
2
Fe
Potential E
H (V)
0
–1.2
–0.8
–0.4
0
0.4
H yd ro ge n lin e
O xy ge n lin e
0.8
1.2
Fe
+3
Fe(OH) 3
Fe(OH) 2
5
3
HFeO 2
–
Fe
+2
1
pH
2
FigurE 2.3
Potential–pH (Pourbaix) diagram for Fe–H 2 O system.