

290 Basic Engineering Mathematics
Problem 3. The distance in miles travelled by
four salesmen in a week are as shown below.
Salesman
P Q R S
Distance travelled (miles) 413 264 597 143
Use a horizontal bar chart to represent these data
diagrammatically
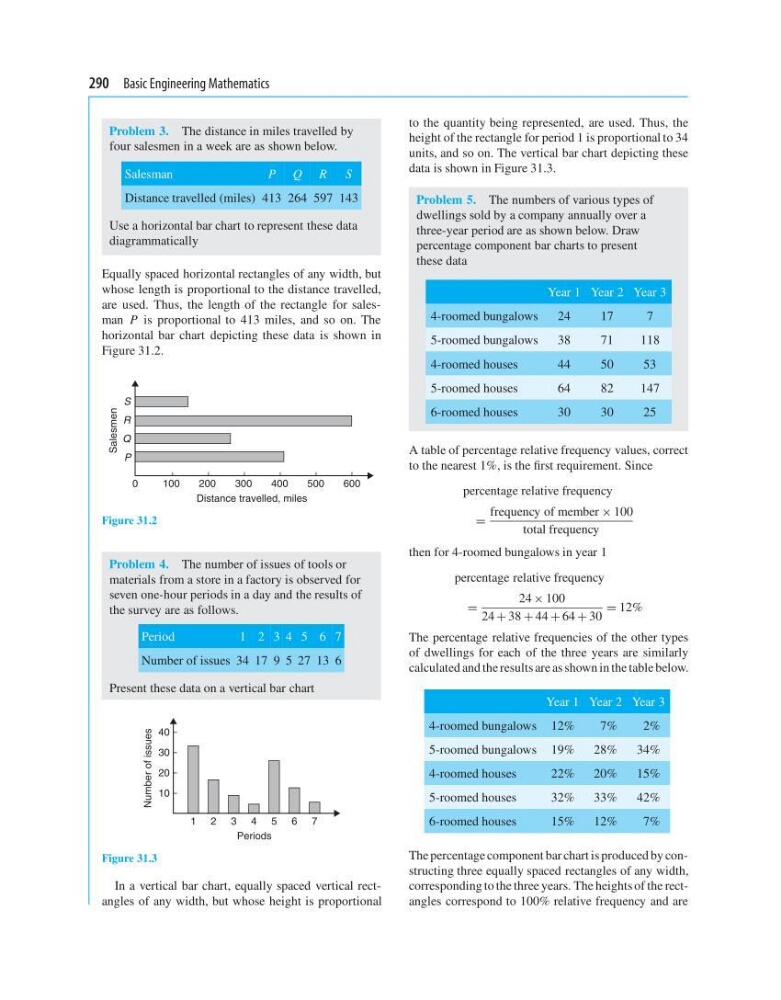
Equally spaced horizontal rectangles of any width, but
whose length is proportional to the distance travelled,
are used. Thus, the length of the rectangle for salesman P is proportional to 413 miles, and so on. The
horizontal bar chart depicting these data is shown in
Figure 31.2.
0
P
Q
Salesmen
R
S
100
200
300
Distance travelled, miles
400
500
600
Figure 31.2
Problem 4. The number of issues of tools or
materials from a store in a factory is observed for
seven one-hour periods in a day and the results of
the survey are as follows.
Period
1 2 3 4 5 6 7
Number of issues 34 17 9 5 27 13 6
Present these data on a vertical bar chart
1
10
20
Number of issues
30
40
2 3 4 5 6
Periods
7
Figure 31.3
In a vertical bar chart, equally spaced vertical rectangles of any width, but whose height is proportional
to the quantity being represented, are used. Thus, the
height of the rectangle for period 1 is proportional to 34
units, and so on. The vertical bar chart depicting these
data is shown in Figure 31.3.
Problem 5. The numbers of various types of
dwellings sold by a company annually over a
three-year period are as shown below. Draw
percentage component bar charts to present
these data
Year 1 Year 2 Year 3
4-roomed bungalows
24
17
7
5-roomed bungalows
38
71
118
4-roomed houses
44
50
53
5-roomed houses
64
82
147
6-roomed houses
30
30
25
A table of percentage relative frequency values, correct
to the nearest 1%, is the first requirement. Since
percentage relative frequency
=
frequency of member × 100
total frequency
then for 4-roomed bungalows in year 1
percentage relative frequency
=
24 × 100
24 + 38 + 44 + 64 + 30
= 12%
The percentage relative frequencies of the other types
of dwellings for each of the three years are similarly
calculated and the results are as shown in the table below.
Year 1 Year 2 Year 3
4-roomed bungalows 12%
7%
2%
5-roomed bungalows 19%
28%
34%
4-roomed houses
22%
20%
15%
5-roomed houses
32%
33%
42%
6-roomed houses
15%
12%
7%
The percentage component bar chart is produced by constructing three equally spaced rectangles of any width,
corresponding to the three years. The heights of the rectangles correspond to 100% relative frequency and are
Problem 3. The distance in miles travelled by
four salesmen in a week are as shown below.
Salesman
P Q R S
Distance travelled (miles) 413 264 597 143
Use a horizontal bar chart to represent these data
diagrammatically
Equally spaced horizontal rectangles of any width, but
whose length is proportional to the distance travelled,
are used. Thus, the length of the rectangle for salesman P is proportional to 413 miles, and so on. The
horizontal bar chart depicting these data is shown in
Figure 31.2.
0
P
Q
Salesmen
R
S
100
200
300
Distance travelled, miles
400
500
600
Figure 31.2
Problem 4. The number of issues of tools or
materials from a store in a factory is observed for
seven one-hour periods in a day and the results of
the survey are as follows.
Period
1 2 3 4 5 6 7
Number of issues 34 17 9 5 27 13 6
Present these data on a vertical bar chart
1
10
20
Number of issues
30
40
2 3 4 5 6
Periods
7
Figure 31.3
In a vertical bar chart, equally spaced vertical rectangles of any width, but whose height is proportional
to the quantity being represented, are used. Thus, the
height of the rectangle for period 1 is proportional to 34
units, and so on. The vertical bar chart depicting these
data is shown in Figure 31.3.
Problem 5. The numbers of various types of
dwellings sold by a company annually over a
three-year period are as shown below. Draw
percentage component bar charts to present
these data
Year 1 Year 2 Year 3
4-roomed bungalows
24
17
7
5-roomed bungalows
38
71
118
4-roomed houses
44
50
53
5-roomed houses
64
82
147
6-roomed houses
30
30
25
A table of percentage relative frequency values, correct
to the nearest 1%, is the first requirement. Since
percentage relative frequency
=
frequency of member × 100
total frequency
then for 4-roomed bungalows in year 1
percentage relative frequency
=
24 × 100
24 + 38 + 44 + 64 + 30
= 12%
The percentage relative frequencies of the other types
of dwellings for each of the three years are similarly
calculated and the results are as shown in the table below.
Year 1 Year 2 Year 3
4-roomed bungalows 12%
7%
2%
5-roomed bungalows 19%
28%
34%
4-roomed houses
22%
20%
15%
5-roomed houses
32%
33%
42%
6-roomed houses
15%
12%
7%
The percentage component bar chart is produced by constructing three equally spaced rectangles of any width,
corresponding to the three years. The heights of the rectangles correspond to 100% relative frequency and are