

258 Basic Engineering Mathematics
(i) Divide base AD into any number of equal
intervals, each of width d (the greater the
number of intervals, the greater the accuracy).
(ii) Erect ordinates in the middle of each interval
(shown by broken lines in Figure 28.2).
(iii) Accurately measure ordinates y 1 , y 2 , y 3 , etc.
(iv) Area ABCD
= d(y 1 + y 2 + y 3 + y 4 + y 5 + y 6 ).
In general, the mid-ordinate rule states
Area = (width of interval)(sum of
mid-ordinates)
(d) Simpson’s rule
To determine the area PQRS of Figure 28.1,
(i) Divide base PS into an even number of intervals, each of width d (the greater the number
of intervals, the greater the accuracy).
(ii) Accurately measure ordinates y 1 , y 2 , y 3 , etc.
(iii) Area PQRS =
d
3
[(y 1 + y 7 ) + 4(y 2 + y 4 + y 6 )
+ 2(y 3 + y 5 )]
In general, Simpson’s rule states
Area =
1
3
width of
interval
first + last
ordinate
+ 4
sum of even
ordinates
+ 2
sum of remaining
odd ordinates
Problem 1. A car starts from rest and its speed is
measured every second for 6 s.
Time t (s)
0 1 2 3
4
5
6
Speed v (m/s) 0 2.5 5.5 8.75 12.5 17.5 24.0
Determine the distance travelled in 6 seconds (i.e.
the area under the v/t graph), using (a) the
trapezoidal rule (b) the mid-ordinate rule
(c) Simpson’s rule
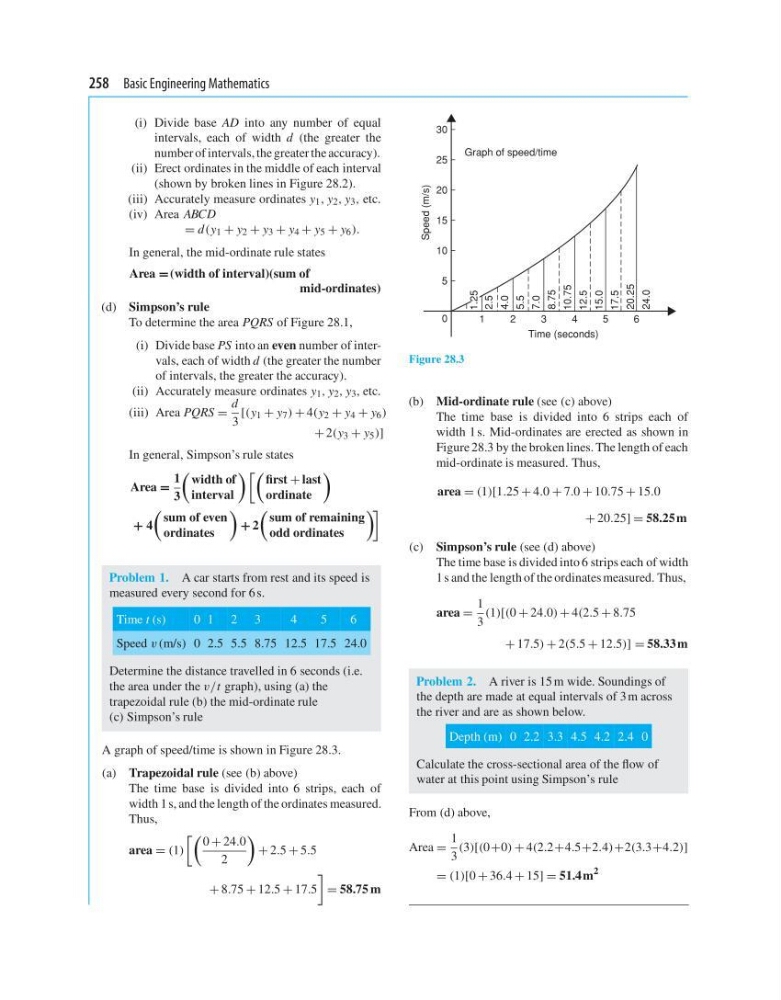
A graph of speed/time is shown in Figure 28.3.
(a) Trapezoidal rule (see (b) above)
The time base is divided into 6 strips, each of
width 1 s, and the length of the ordinates measured.
Thus,
area = (1)
0 + 24.0
2
+ 2.5 + 5.5
+ 8.75 + 12.5 + 17.5
= 58.75 m
Graph of speed/time
Speed (m/s)
30
25
20
15
10
5
2.5
4.0
5.5
7.0
8.75
10.75
12.5
15.0
17.5
20.25
24.0
0
1
2
3
Time (seconds)
4
5
6
1.25
Figure 28.3
(b) Mid-ordinate rule (see (c) above)
The time base is divided into 6 strips each of
width 1 s. Mid-ordinates are erected as shown in
Figure 28.3 by the broken lines. The length of each
mid-ordinate is measured. Thus,
area = (1)[1.25 + 4.0 + 7.0 + 10.75 + 15.0
+ 20.25] = 58.25 m
(c) Simpson’s rule (see (d) above)
The time base is divided into 6 strips each of width
1 s and the length of the ordinates measured. Thus,
area =
1
3
(1)[(0 + 24.0) + 4(2.5 + 8.75
+ 17.5) + 2(5.5 + 12.5)] = 58.33 m
Problem 2. A river is 15 m wide. Soundings of
the depth are made at equal intervals of 3 m across
the river and are as shown below.
Depth (m) 0 2.2 3.3 4.5 4.2 2.4 0
Calculate the cross-sectional area of the flow of
water at this point using Simpson’s rule
From (d) above,
Area =
1
3
(3)[(0+0) + 4(2.2+4.5+2.4)+2(3.3+4.2)]
= (1)[0 + 36.4 + 15] = 51.4 m
2
(i) Divide base AD into any number of equal
intervals, each of width d (the greater the
number of intervals, the greater the accuracy).
(ii) Erect ordinates in the middle of each interval
(shown by broken lines in Figure 28.2).
(iii) Accurately measure ordinates y 1 , y 2 , y 3 , etc.
(iv) Area ABCD
= d(y 1 + y 2 + y 3 + y 4 + y 5 + y 6 ).
In general, the mid-ordinate rule states
Area = (width of interval)(sum of
mid-ordinates)
(d) Simpson’s rule
To determine the area PQRS of Figure 28.1,
(i) Divide base PS into an even number of intervals, each of width d (the greater the number
of intervals, the greater the accuracy).
(ii) Accurately measure ordinates y 1 , y 2 , y 3 , etc.
(iii) Area PQRS =
d
3
[(y 1 + y 7 ) + 4(y 2 + y 4 + y 6 )
+ 2(y 3 + y 5 )]
In general, Simpson’s rule states
Area =
1
3
width of
interval
first + last
ordinate
+ 4
sum of even
ordinates
+ 2
sum of remaining
odd ordinates
Problem 1. A car starts from rest and its speed is
measured every second for 6 s.
Time t (s)
0 1 2 3
4
5
6
Speed v (m/s) 0 2.5 5.5 8.75 12.5 17.5 24.0
Determine the distance travelled in 6 seconds (i.e.
the area under the v/t graph), using (a) the
trapezoidal rule (b) the mid-ordinate rule
(c) Simpson’s rule
A graph of speed/time is shown in Figure 28.3.
(a) Trapezoidal rule (see (b) above)
The time base is divided into 6 strips, each of
width 1 s, and the length of the ordinates measured.
Thus,
area = (1)
0 + 24.0
2
+ 2.5 + 5.5
+ 8.75 + 12.5 + 17.5
= 58.75 m
Graph of speed/time
Speed (m/s)
30
25
20
15
10
5
2.5
4.0
5.5
7.0
8.75
10.75
12.5
15.0
17.5
20.25
24.0
0
1
2
3
Time (seconds)
4
5
6
1.25
Figure 28.3
(b) Mid-ordinate rule (see (c) above)
The time base is divided into 6 strips each of
width 1 s. Mid-ordinates are erected as shown in
Figure 28.3 by the broken lines. The length of each
mid-ordinate is measured. Thus,
area = (1)[1.25 + 4.0 + 7.0 + 10.75 + 15.0
+ 20.25] = 58.25 m
(c) Simpson’s rule (see (d) above)
The time base is divided into 6 strips each of width
1 s and the length of the ordinates measured. Thus,
area =
1
3
(1)[(0 + 24.0) + 4(2.5 + 8.75
+ 17.5) + 2(5.5 + 12.5)] = 58.33 m
Problem 2. A river is 15 m wide. Soundings of
the depth are made at equal intervals of 3 m across
the river and are as shown below.
Depth (m) 0 2.2 3.3 4.5 4.2 2.4 0
Calculate the cross-sectional area of the flow of
water at this point using Simpson’s rule
From (d) above,
Area =
1
3
(3)[(0+0) + 4(2.2+4.5+2.4)+2(3.3+4.2)]
= (1)[0 + 36.4 + 15] = 51.4 m
2