

Trigonometric waveforms 199
20.5
0.5
21.0
1.0
y
S
R
T
S9
O9
y 5 cos x
Angle x8
308 608
1208
1808
2408
3008
3608
458
08
158
3308
3158
2858
2558
08
2258
2108
1808
1508
1208
908
608
O
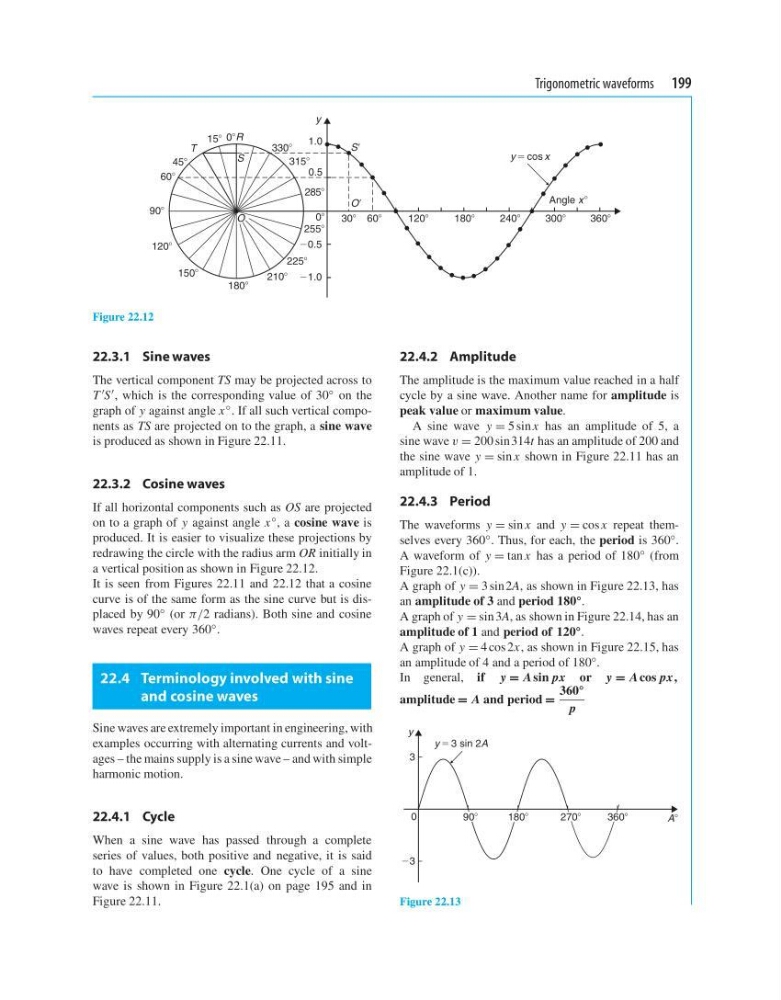
Figure 22.12
22.3.1 Sine waves
The vertical component TS may be projected across to
T S , which is the corresponding value of 30 ◦ on the
graph of y against angle x ◦ . If all such vertical components as TS are projected on to the graph, a sine wave
is produced as shown in Figure 22.11.
22.3.2 Cosine waves
If all horizontal components such as OS are projected
on to a graph of y against angle x ◦ , a cosine wave is
produced. It is easier to visualize these projections by
redrawing the circle with the radius arm OR initially in
a vertical position as shown in Figure 22.12.
It is seen from Figures 22.11 and 22.12 that a cosine
curve is of the same form as the sine curve but is displaced by 90 ◦ (or π/2 radians). Both sine and cosine
waves repeat every 360 ◦ .
22.4 Terminology involved with sine
and cosine waves
Sine waves are extremely important in engineering, with
examples occurring with alternating currents and voltages – the mains supply is a sine wave – and with simple
harmonic motion.
22.4.1 Cycle
When a sine wave has passed through a complete
series of values, both positive and negative, it is said
to have completed one cycle. One cycle of a sine
wave is shown in Figure 22.1(a) on page 195 and in
Figure 22.11.
22.4.2 Amplitude
The amplitude is the maximum value reached in a half
cycle by a sine wave. Another name for amplitude is
peak value or maximum value.
A sine wave y = 5 sin x has an amplitude of 5, a
sine wave v = 200 sin 314t has an amplitude of 200 and
the sine wave y = sin x shown in Figure 22.11 has an
amplitude of 1.
22.4.3 Period
The waveforms y = sin x and y = cos x repeat themselves every 360 ◦ . Thus, for each, the period is 360 ◦ .
A waveform of y = tan x has a period of 180 ◦ (from
Figure 22.1(c)).
A graph of y = 3 sin2A, as shown in Figure 22.13, has
an amplitude of 3 and period 180 ◦ .
A graph of y = sin 3A, as shown in Figure 22.14, has an
amplitude of 1 and period of 120 ◦ .
A graph of y = 4 cos 2x, as shown in Figure 22.15, has
an amplitude of 4 and a period of 180 ◦ .
In general, if y = A sin px or y = A cos px,
amplitude = A and period =
360 ◦
p
y
3
23
0
A8
y 5 3 sin 2A
2708
3608
1808
908
Figure 22.13
20.5
0.5
21.0
1.0
y
S
R
T
S9
O9
y 5 cos x
Angle x8
308 608
1208
1808
2408
3008
3608
458
08
158
3308
3158
2858
2558
08
2258
2108
1808
1508
1208
908
608
O
Figure 22.12
22.3.1 Sine waves
The vertical component TS may be projected across to
T S , which is the corresponding value of 30 ◦ on the
graph of y against angle x ◦ . If all such vertical components as TS are projected on to the graph, a sine wave
is produced as shown in Figure 22.11.
22.3.2 Cosine waves
If all horizontal components such as OS are projected
on to a graph of y against angle x ◦ , a cosine wave is
produced. It is easier to visualize these projections by
redrawing the circle with the radius arm OR initially in
a vertical position as shown in Figure 22.12.
It is seen from Figures 22.11 and 22.12 that a cosine
curve is of the same form as the sine curve but is displaced by 90 ◦ (or π/2 radians). Both sine and cosine
waves repeat every 360 ◦ .
22.4 Terminology involved with sine
and cosine waves
Sine waves are extremely important in engineering, with
examples occurring with alternating currents and voltages – the mains supply is a sine wave – and with simple
harmonic motion.
22.4.1 Cycle
When a sine wave has passed through a complete
series of values, both positive and negative, it is said
to have completed one cycle. One cycle of a sine
wave is shown in Figure 22.1(a) on page 195 and in
Figure 22.11.
22.4.2 Amplitude
The amplitude is the maximum value reached in a half
cycle by a sine wave. Another name for amplitude is
peak value or maximum value.
A sine wave y = 5 sin x has an amplitude of 5, a
sine wave v = 200 sin 314t has an amplitude of 200 and
the sine wave y = sin x shown in Figure 22.11 has an
amplitude of 1.
22.4.3 Period
The waveforms y = sin x and y = cos x repeat themselves every 360 ◦ . Thus, for each, the period is 360 ◦ .
A waveform of y = tan x has a period of 180 ◦ (from
Figure 22.1(c)).
A graph of y = 3 sin2A, as shown in Figure 22.13, has
an amplitude of 3 and period 180 ◦ .
A graph of y = sin 3A, as shown in Figure 22.14, has an
amplitude of 1 and period of 120 ◦ .
A graph of y = 4 cos 2x, as shown in Figure 22.15, has
an amplitude of 4 and a period of 180 ◦ .
In general, if y = A sin px or y = A cos px,
amplitude = A and period =
360 ◦
p
y
3
23
0
A8
y 5 3 sin 2A
2708
3608
1808
908
Figure 22.13