

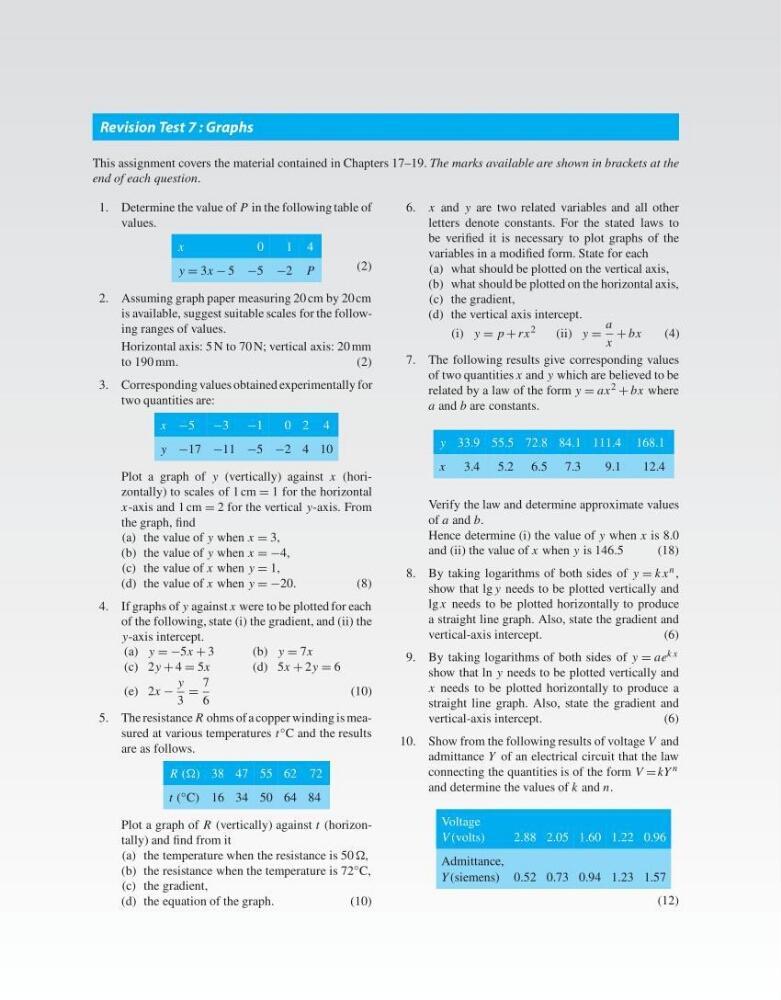
Revision Test 7 : Graphs
This assignment covers the material contained in Chapters 17–19. The marks available are shown in brackets at the
end of each question.
1. Determine the value of P in the following table of
values.
x
0
1 4
y = 3x − 5 −5 −2 P
(2)
2. Assuming graph paper measuring 20 cm by 20 cm
is available, suggest suitable scales for the following ranges of values.
Horizontal axis: 5 N to 70 N; vertical axis: 20 mm
to 190 mm.
(2)
3. Corresponding values obtained experimentally for
two quantities are:
x −5 −3 −1
0 2 4
y −17 −11 −5 −2 4 10
Plot a graph of y (vertically) against x (horizontally) to scales of 1 cm = 1 for the horizontal
x-axis and 1 cm = 2 for the vertical y-axis. From
the graph, find
(a) the value of y when x = 3,
(b) the value of y when x = −4,
(c) the value of x when y = 1,
(d) the value of x when y = −20.
(8)
4. If graphs of y against x were to be plotted for each
of the following, state (i) the gradient, and (ii) the
y-axis intercept.
(a) y = −5x + 3
(b) y = 7x
(c) 2y + 4 = 5x
(d) 5x + 2y = 6
(e) 2x −
y
3
=
7
6
(10)
5. The resistance R ohms of a copper winding is measured at various temperatures t ◦ C and the results
are as follows.
R () 38 47 55 62 72
t ( ◦ C) 16 34 50 64 84
Plot a graph of R (vertically) against t (horizontally) and find from it
(a) the temperature when the resistance is 50 ,
(b) the resistance when the temperature is 72 ◦ C,
(c) the gradient,
(d) the equation of the graph.
(10)
6. x and y are two related variables and all other
letters denote constants. For the stated laws to
be verified it is necessary to plot graphs of the
variables in a modified form. State for each
(a) what should be plotted on the vertical axis,
(b) what should be plotted on the horizontal axis,
(c) the gradient,
(d) the vertical axis intercept.
(i) y = p + rx
2
(ii) y =
a
x
+ bx
(4)
7. The following results give corresponding values
of two quantities x and y which are believed to be
related by a law of the form y = ax 2 + bx where
a and b are constants.
y 33.9 55.5 72.8 84.1 111.4 168.1
x 3.4 5.2 6.5 7.3
9.1
12.4
Verify the law and determine approximate values
of a and b.
Hence determine (i) the value of y when x is 8.0
and (ii) the value of x when y is 146.5
(18)
8. By taking logarithms of both sides of y = k x n ,
show that lg y needs to be plotted vertically and
lg x needs to be plotted horizontally to produce
a straight line graph. Also, state the gradient and
vertical-axis intercept.
(6)
9. By taking logarithms of both sides of y = ae k x
show that ln y needs to be plotted vertically and
x needs to be plotted horizontally to produce a
straight line graph. Also, state the gradient and
vertical-axis intercept.
(6)
10. Show from the following results of voltage V and
admittance Y of an electrical circuit that the law
connecting the quantities is of the form V = kY n
and determine the values of k and n.
Voltage
V (volts)
2.88 2.05 1.60 1.22 0.96
Admittance,
Y (siemens) 0.52 0.73 0.94 1.23 1.57
(12)
This assignment covers the material contained in Chapters 17–19. The marks available are shown in brackets at the
end of each question.
1. Determine the value of P in the following table of
values.
x
0
1 4
y = 3x − 5 −5 −2 P
(2)
2. Assuming graph paper measuring 20 cm by 20 cm
is available, suggest suitable scales for the following ranges of values.
Horizontal axis: 5 N to 70 N; vertical axis: 20 mm
to 190 mm.
(2)
3. Corresponding values obtained experimentally for
two quantities are:
x −5 −3 −1
0 2 4
y −17 −11 −5 −2 4 10
Plot a graph of y (vertically) against x (horizontally) to scales of 1 cm = 1 for the horizontal
x-axis and 1 cm = 2 for the vertical y-axis. From
the graph, find
(a) the value of y when x = 3,
(b) the value of y when x = −4,
(c) the value of x when y = 1,
(d) the value of x when y = −20.
(8)
4. If graphs of y against x were to be plotted for each
of the following, state (i) the gradient, and (ii) the
y-axis intercept.
(a) y = −5x + 3
(b) y = 7x
(c) 2y + 4 = 5x
(d) 5x + 2y = 6
(e) 2x −
y
3
=
7
6
(10)
5. The resistance R ohms of a copper winding is measured at various temperatures t ◦ C and the results
are as follows.
R () 38 47 55 62 72
t ( ◦ C) 16 34 50 64 84
Plot a graph of R (vertically) against t (horizontally) and find from it
(a) the temperature when the resistance is 50 ,
(b) the resistance when the temperature is 72 ◦ C,
(c) the gradient,
(d) the equation of the graph.
(10)
6. x and y are two related variables and all other
letters denote constants. For the stated laws to
be verified it is necessary to plot graphs of the
variables in a modified form. State for each
(a) what should be plotted on the vertical axis,
(b) what should be plotted on the horizontal axis,
(c) the gradient,
(d) the vertical axis intercept.
(i) y = p + rx
2
(ii) y =
a
x
+ bx
(4)
7. The following results give corresponding values
of two quantities x and y which are believed to be
related by a law of the form y = ax 2 + bx where
a and b are constants.
y 33.9 55.5 72.8 84.1 111.4 168.1
x 3.4 5.2 6.5 7.3
9.1
12.4
Verify the law and determine approximate values
of a and b.
Hence determine (i) the value of y when x is 8.0
and (ii) the value of x when y is 146.5
(18)
8. By taking logarithms of both sides of y = k x n ,
show that lg y needs to be plotted vertically and
lg x needs to be plotted horizontally to produce
a straight line graph. Also, state the gradient and
vertical-axis intercept.
(6)
9. By taking logarithms of both sides of y = ae k x
show that ln y needs to be plotted vertically and
x needs to be plotted horizontally to produce a
straight line graph. Also, state the gradient and
vertical-axis intercept.
(6)
10. Show from the following results of voltage V and
admittance Y of an electrical circuit that the law
connecting the quantities is of the form V = kY n
and determine the values of k and n.
Voltage
V (volts)
2.88 2.05 1.60 1.22 0.96
Admittance,
Y (siemens) 0.52 0.73 0.94 1.23 1.57
(12)