

Exponential functions 121
Table 16.1
x
−3.0 −2.5 −2.0 −1.5 −1.0 −0.5
0
0.5
1.0
1.5 2.0
2.5
3.0
e
x
0.05
0.08 0.14
0.22
0.37
0.61 1.00 1.65 2.72 4.48 7.39 12.18 20.09
e −x 20.09 12.18 7.39
4.48
2.72
1.65 1.00 0.61 0.37 0.22 0.14 0.08 0.05
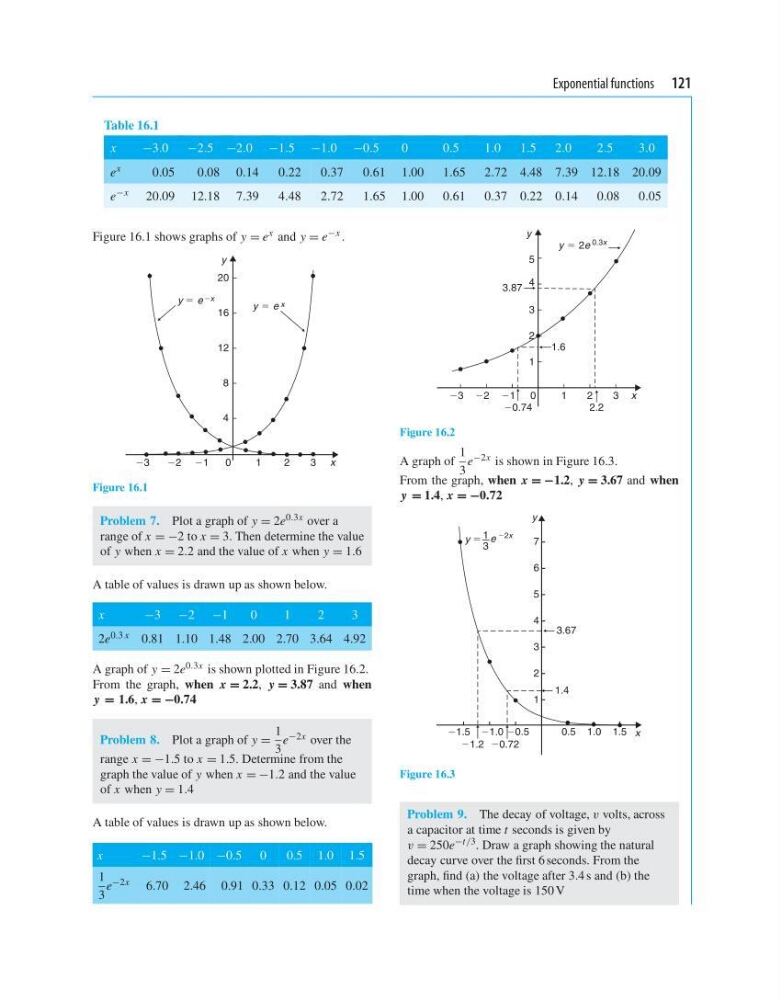
Figure 16.1 shows graphs of y = e x and y = e −x .
y
20
16
y ϭ e x
y ϭ e Ϫx
12
8
4
Ϫ1
0
1
2
3 x
Ϫ2
Ϫ3
Figure 16.1
Problem 7. Plot a graph of y = 2e 0.3x over a
range of x = −2 to x = 3. Then determine the value
of y when x = 2.2 and the value of x when y = 1.6
A table of values is drawn up as shown below.
x
−3 −2 −1
0
1
2
3
2e 0.3 x 0.81 1.10 1.48 2.00 2.70 3.64 4.92
A graph of y = 2e 0.3x is shown plotted in Figure 16.2.
From the graph, when x = 2.2, y = 3.87 and when
y = 1.6, x = −0.74
Problem 8. Plot a graph of y =
1
3
e −2x over the
range x = −1.5 to x = 1.5. Determine from the
graph the value of y when x = −1.2 and the value
of x when y = 1.4
A table of values is drawn up as shown below.
x
−1.5 −1.0 −0.5 0
0.5 1.0 1.5
1
3
e −2x 6.70 2.46 0.91 0.33 0.12 0.05 0.02
y
5
y ϭ 2e 0.3x
4
3
2
1.6
3.87
1
Ϫ0.74
2.2
Ϫ1 0
1
2
3 x
Ϫ2
Ϫ3
Figure 16.2
A graph of
1
3
e −2x is shown in Figure 16.3.
From the graph, when x = −1.2, y = 3.67 and when
y = 1.4, x = −0.72
y
6
5
4
2
3
1
7
0.5
x
1.0 1.5
Ϫ0.5
Ϫ1.2 Ϫ0.72
Ϫ1.0
Ϫ1.5
3.67
1.4
y ϭ 1
3
e Ϫ2x
Figure 16.3
Problem 9. The decay of voltage, v volts, across
a capacitor at time t seconds is given by
v = 250e −t /3 . Draw a graph showing the natural
decay curve over the first 6 seconds. From the
graph, find (a) the voltage after 3.4 s and (b) the
time when the voltage is 150 V
Table 16.1
x
−3.0 −2.5 −2.0 −1.5 −1.0 −0.5
0
0.5
1.0
1.5 2.0
2.5
3.0
e
x
0.05
0.08 0.14
0.22
0.37
0.61 1.00 1.65 2.72 4.48 7.39 12.18 20.09
e −x 20.09 12.18 7.39
4.48
2.72
1.65 1.00 0.61 0.37 0.22 0.14 0.08 0.05
Figure 16.1 shows graphs of y = e x and y = e −x .
y
20
16
y ϭ e x
y ϭ e Ϫx
12
8
4
Ϫ1
0
1
2
3 x
Ϫ2
Ϫ3
Figure 16.1
Problem 7. Plot a graph of y = 2e 0.3x over a
range of x = −2 to x = 3. Then determine the value
of y when x = 2.2 and the value of x when y = 1.6
A table of values is drawn up as shown below.
x
−3 −2 −1
0
1
2
3
2e 0.3 x 0.81 1.10 1.48 2.00 2.70 3.64 4.92
A graph of y = 2e 0.3x is shown plotted in Figure 16.2.
From the graph, when x = 2.2, y = 3.87 and when
y = 1.6, x = −0.74
Problem 8. Plot a graph of y =
1
3
e −2x over the
range x = −1.5 to x = 1.5. Determine from the
graph the value of y when x = −1.2 and the value
of x when y = 1.4
A table of values is drawn up as shown below.
x
−1.5 −1.0 −0.5 0
0.5 1.0 1.5
1
3
e −2x 6.70 2.46 0.91 0.33 0.12 0.05 0.02
y
5
y ϭ 2e 0.3x
4
3
2
1.6
3.87
1
Ϫ0.74
2.2
Ϫ1 0
1
2
3 x
Ϫ2
Ϫ3
Figure 16.2
A graph of
1
3
e −2x is shown in Figure 16.3.
From the graph, when x = −1.2, y = 3.67 and when
y = 1.4, x = −0.72
y
6
5
4
2
3
1
7
0.5
x
1.0 1.5
Ϫ0.5
Ϫ1.2 Ϫ0.72
Ϫ1.0
Ϫ1.5
3.67
1.4
y ϭ 1
3
e Ϫ2x
Figure 16.3
Problem 9. The decay of voltage, v volts, across
a capacitor at time t seconds is given by
v = 250e −t /3 . Draw a graph showing the natural
decay curve over the first 6 seconds. From the
graph, find (a) the voltage after 3.4 s and (b) the
time when the voltage is 150 V