

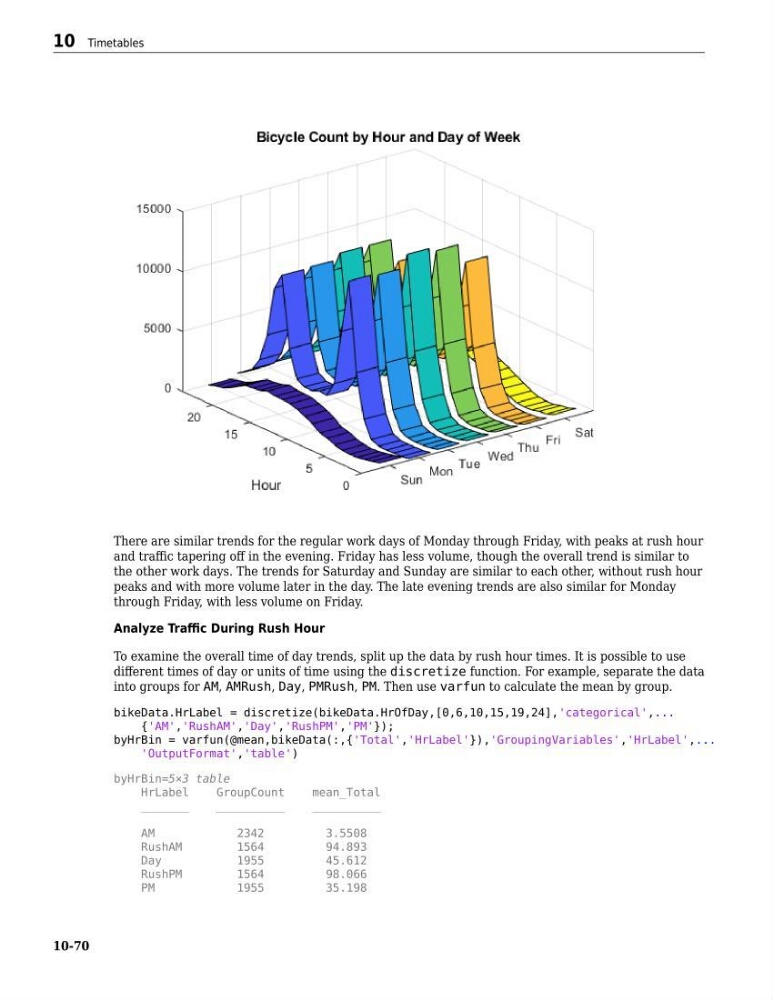
There are similar trends for the regular work days of Monday through Friday, with peaks at rush hour
and traffic tapering off in the evening. Friday has less volume, though the overall trend is similar to
the other work days. The trends for Saturday and Sunday are similar to each other, without rush hour
peaks and with more volume later in the day. The late evening trends are also similar for Monday
through Friday, with less volume on Friday.
Analyze Traffic During Rush Hour
To examine the overall time of day trends, split up the data by rush hour times. It is possible to use
different times of day or units of time using the discretize function. For example, separate the data
into groups for AM, AMRush, Day, PMRush, PM. Then use varfun to calculate the mean by group.
bikeData.HrLabel = discretize(bikeData.HrOfDay,[0,6,10,15,19,24],'categorical',...
{'AM','RushAM','Day','RushPM','PM'});
byHrBin = varfun(@mean,bikeData(:,{'Total','HrLabel'}),'GroupingVariables','HrLabel',...
'OutputFormat','table')
byHrBin=5×3 table
HrLabel
GroupCount
mean_Total
_______
__________
__________
AM
2342
3.5508
RushAM
1564
94.893
Day
1955
45.612
RushPM
1564
98.066
PM
1955
35.198
10 Timetables
10-70
and traffic tapering off in the evening. Friday has less volume, though the overall trend is similar to
the other work days. The trends for Saturday and Sunday are similar to each other, without rush hour
peaks and with more volume later in the day. The late evening trends are also similar for Monday
through Friday, with less volume on Friday.
Analyze Traffic During Rush Hour
To examine the overall time of day trends, split up the data by rush hour times. It is possible to use
different times of day or units of time using the discretize function. For example, separate the data
into groups for AM, AMRush, Day, PMRush, PM. Then use varfun to calculate the mean by group.
bikeData.HrLabel = discretize(bikeData.HrOfDay,[0,6,10,15,19,24],'categorical',...
{'AM','RushAM','Day','RushPM','PM'});
byHrBin = varfun(@mean,bikeData(:,{'Total','HrLabel'}),'GroupingVariables','HrLabel',...
'OutputFormat','table')
byHrBin=5×3 table
HrLabel
GroupCount
mean_Total
_______
__________
__________
AM
2342
3.5508
RushAM
1564
94.893
Day
1955
45.612
RushPM
1564
98.066
PM
1955
35.198
10 Timetables
10-70