

Preprocess and Explore Time-stamped Data Using timetable
This example shows how to analyze bicycle traffic patterns from sensor data using the timetable
data container to organize and preprocess time-stamped data. The data come from sensors on
Broadway Street in Cambridge, MA. The City of Cambridge provides public access to the full data set
at the Cambridge Open Data site.
This example shows how to perform a variety of data cleaning, munging, and preprocessing tasks
such as removing missing values and synchronizing time-stamped data with different timesteps. In
addition, data exploration is highlighted including visualizations and grouped calculations using the
timetable data container to:
• Explore daily bicycle traffic
• Compare bicycle traffic to local weather conditions
• Analyze bicycle traffic on various days of the week and times of day
Import Bicycle Traffic Data into Timetable
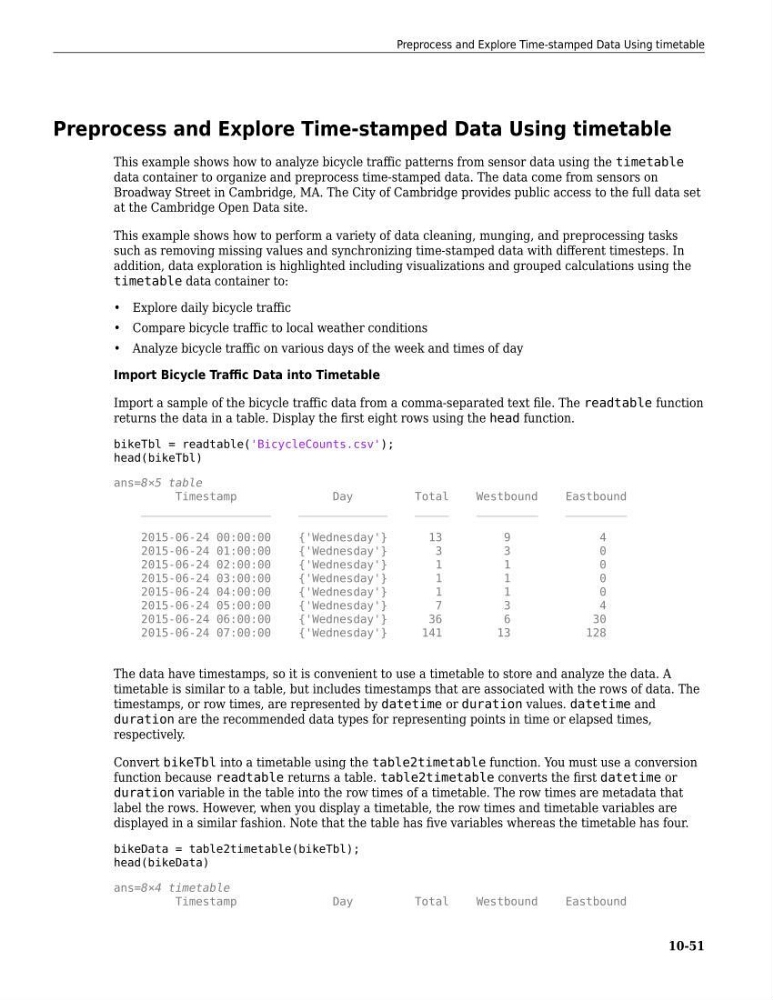
Import a sample of the bicycle traffic data from a comma-separated text file. The readtable function
returns the data in a table. Display the first eight rows using the head function.
bikeTbl = readtable('BicycleCounts.csv');
head(bikeTbl)
ans=8×5 table
Timestamp
Day
Total
Westbound
Eastbound
___________________
_____________
_____
_________
_________
2015-06-24 00:00:00
{'Wednesday'}
13
9
4
2015-06-24 01:00:00
{'Wednesday'}
3
3
0
2015-06-24 02:00:00
{'Wednesday'}
1
1
0
2015-06-24 03:00:00
{'Wednesday'}
1
1
0
2015-06-24 04:00:00
{'Wednesday'}
1
1
0
2015-06-24 05:00:00
{'Wednesday'}
7
3
4
2015-06-24 06:00:00
{'Wednesday'}
36
6
30
2015-06-24 07:00:00
{'Wednesday'}
141
13
128
The data have timestamps, so it is convenient to use a timetable to store and analyze the data. A
timetable is similar to a table, but includes timestamps that are associated with the rows of data. The
timestamps, or row times, are represented by datetime or duration values. datetime and
duration are the recommended data types for representing points in time or elapsed times,
respectively.
Convert bikeTbl into a timetable using the table2timetable function. You must use a conversion
function because readtable returns a table. table2timetable converts the first datetime or
duration variable in the table into the row times of a timetable. The row times are metadata that
label the rows. However, when you display a timetable, the row times and timetable variables are
displayed in a similar fashion. Note that the table has five variables whereas the timetable has four.
bikeData = table2timetable(bikeTbl);
head(bikeData)
ans=8×4 timetable
Timestamp
Day
Total
Westbound
Eastbound
Preprocess and Explore Time-stamped Data Using timetable
10-51
This example shows how to analyze bicycle traffic patterns from sensor data using the timetable
data container to organize and preprocess time-stamped data. The data come from sensors on
Broadway Street in Cambridge, MA. The City of Cambridge provides public access to the full data set
at the Cambridge Open Data site.
This example shows how to perform a variety of data cleaning, munging, and preprocessing tasks
such as removing missing values and synchronizing time-stamped data with different timesteps. In
addition, data exploration is highlighted including visualizations and grouped calculations using the
timetable data container to:
• Explore daily bicycle traffic
• Compare bicycle traffic to local weather conditions
• Analyze bicycle traffic on various days of the week and times of day
Import Bicycle Traffic Data into Timetable
Import a sample of the bicycle traffic data from a comma-separated text file. The readtable function
returns the data in a table. Display the first eight rows using the head function.
bikeTbl = readtable('BicycleCounts.csv');
head(bikeTbl)
ans=8×5 table
Timestamp
Day
Total
Westbound
Eastbound
___________________
_____________
_____
_________
_________
2015-06-24 00:00:00
{'Wednesday'}
13
9
4
2015-06-24 01:00:00
{'Wednesday'}
3
3
0
2015-06-24 02:00:00
{'Wednesday'}
1
1
0
2015-06-24 03:00:00
{'Wednesday'}
1
1
0
2015-06-24 04:00:00
{'Wednesday'}
1
1
0
2015-06-24 05:00:00
{'Wednesday'}
7
3
4
2015-06-24 06:00:00
{'Wednesday'}
36
6
30
2015-06-24 07:00:00
{'Wednesday'}
141
13
128
The data have timestamps, so it is convenient to use a timetable to store and analyze the data. A
timetable is similar to a table, but includes timestamps that are associated with the rows of data. The
timestamps, or row times, are represented by datetime or duration values. datetime and
duration are the recommended data types for representing points in time or elapsed times,
respectively.
Convert bikeTbl into a timetable using the table2timetable function. You must use a conversion
function because readtable returns a table. table2timetable converts the first datetime or
duration variable in the table into the row times of a timetable. The row times are metadata that
label the rows. However, when you display a timetable, the row times and timetable variables are
displayed in a similar fashion. Note that the table has five variables whereas the timetable has four.
bikeData = table2timetable(bikeTbl);
head(bikeData)
ans=8×4 timetable
Timestamp
Day
Total
Westbound
Eastbound
Preprocess and Explore Time-stamped Data Using timetable
10-51