

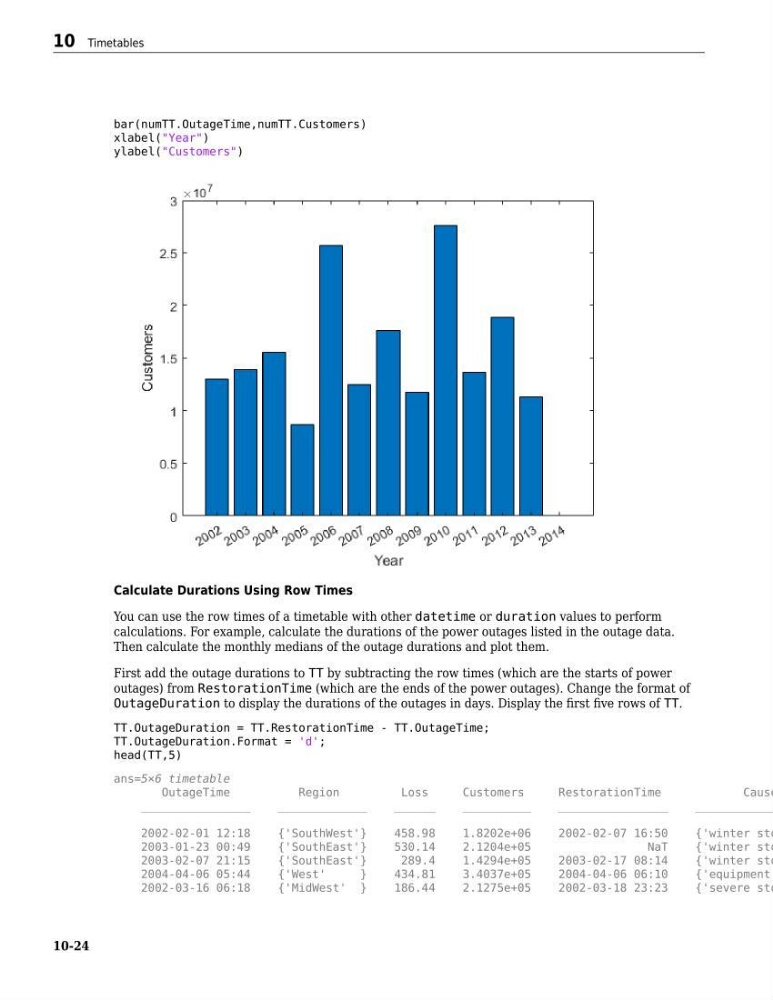
bar(numTT.OutageTime,numTT.Customers)
xlabel("Year")
ylabel("Customers")
Calculate Durations Using Row Times
You can use the row times of a timetable with other datetime or duration values to perform
calculations. For example, calculate the durations of the power outages listed in the outage data.
Then calculate the monthly medians of the outage durations and plot them.
First add the outage durations to TT by subtracting the row times (which are the starts of power
outages) from RestorationTime (which are the ends of the power outages). Change the format of
OutageDuration to display the durations of the outages in days. Display the first five rows of TT.
TT.OutageDuration = TT.RestorationTime - TT.OutageTime;
TT.OutageDuration.Format = 'd';
head(TT,5)
ans=5×6 timetable
OutageTime
Region
Loss
Customers
RestorationTime
Cause
________________
_____________
______
__________
________________
____________
2002-02-01 12:18
{'SouthWest'}
458.98
1.8202e+06
2002-02-07 16:50
{'winter sto
2003-01-23 00:49
{'SouthEast'}
530.14
2.1204e+05
NaT
{'winter sto
2003-02-07 21:15
{'SouthEast'}
289.4
1.4294e+05
2003-02-17 08:14
{'winter sto
2004-04-06 05:44
{'West'
}
434.81
3.4037e+05
2004-04-06 06:10
{'equipment
2002-03-16 06:18
{'MidWest' }
186.44
2.1275e+05
2002-03-18 23:23
{'severe sto
10 Timetables
10-24
xlabel("Year")
ylabel("Customers")
Calculate Durations Using Row Times
You can use the row times of a timetable with other datetime or duration values to perform
calculations. For example, calculate the durations of the power outages listed in the outage data.
Then calculate the monthly medians of the outage durations and plot them.
First add the outage durations to TT by subtracting the row times (which are the starts of power
outages) from RestorationTime (which are the ends of the power outages). Change the format of
OutageDuration to display the durations of the outages in days. Display the first five rows of TT.
TT.OutageDuration = TT.RestorationTime - TT.OutageTime;
TT.OutageDuration.Format = 'd';
head(TT,5)
ans=5×6 timetable
OutageTime
Region
Loss
Customers
RestorationTime
Cause
________________
_____________
______
__________
________________
____________
2002-02-01 12:18
{'SouthWest'}
458.98
1.8202e+06
2002-02-07 16:50
{'winter sto
2003-01-23 00:49
{'SouthEast'}
530.14
2.1204e+05
NaT
{'winter sto
2003-02-07 21:15
{'SouthEast'}
289.4
1.4294e+05
2003-02-17 08:14
{'winter sto
2004-04-06 05:44
{'West'
}
434.81
3.4037e+05
2004-04-06 06:10
{'equipment
2002-03-16 06:18
{'MidWest' }
186.44
2.1275e+05
2002-03-18 23:23
{'severe sto
10 Timetables
10-24