

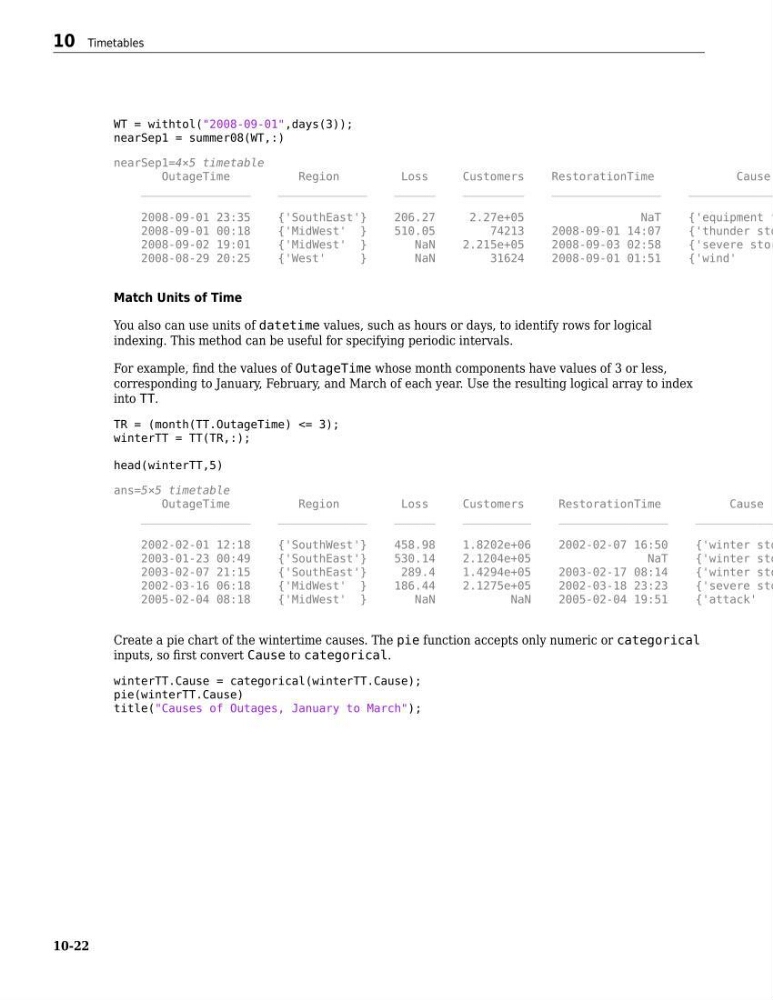
WT = withtol("2008-09-01",days(3));
nearSep1 = summer08(WT,:)
nearSep1=4×5 timetable
OutageTime
Region
Loss
Customers
RestorationTime
Cause
________________
_____________
______
_________
________________
_____________
2008-09-01 23:35
{'SouthEast'}
206.27
2.27e+05
NaT
{'equipment f
2008-09-01 00:18
{'MidWest' }
510.05
74213
2008-09-01 14:07
{'thunder sto
2008-09-02 19:01
{'MidWest' }
NaN
2.215e+05
2008-09-03 02:58
{'severe stor
2008-08-29 20:25
{'West'
}
NaN
31624
2008-09-01 01:51
{'wind'
Match Units of Time
You also can use units of datetime values, such as hours or days, to identify rows for logical
indexing. This method can be useful for specifying periodic intervals.
For example, find the values of OutageTime whose month components have values of 3 or less,
corresponding to January, February, and March of each year. Use the resulting logical array to index
into TT.
TR = (month(TT.OutageTime) <= 3);
winterTT = TT(TR,:);
head(winterTT,5)
ans=5×5 timetable
OutageTime
Region
Loss
Customers
RestorationTime
Cause
________________
_____________
______
__________
________________
____________
2002-02-01 12:18
{'SouthWest'}
458.98
1.8202e+06
2002-02-07 16:50
{'winter sto
2003-01-23 00:49
{'SouthEast'}
530.14
2.1204e+05
NaT
{'winter sto
2003-02-07 21:15
{'SouthEast'}
289.4
1.4294e+05
2003-02-17 08:14
{'winter sto
2002-03-16 06:18
{'MidWest' }
186.44
2.1275e+05
2002-03-18 23:23
{'severe sto
2005-02-04 08:18
{'MidWest' }
NaN
NaN
2005-02-04 19:51
{'attack'
Create a pie chart of the wintertime causes. The pie function accepts only numeric or categorical
inputs, so first convert Cause to categorical.
winterTT.Cause = categorical(winterTT.Cause);
pie(winterTT.Cause)
title("Causes of Outages, January to March");
10 Timetables
10-22
nearSep1 = summer08(WT,:)
nearSep1=4×5 timetable
OutageTime
Region
Loss
Customers
RestorationTime
Cause
________________
_____________
______
_________
________________
_____________
2008-09-01 23:35
{'SouthEast'}
206.27
2.27e+05
NaT
{'equipment f
2008-09-01 00:18
{'MidWest' }
510.05
74213
2008-09-01 14:07
{'thunder sto
2008-09-02 19:01
{'MidWest' }
NaN
2.215e+05
2008-09-03 02:58
{'severe stor
2008-08-29 20:25
{'West'
}
NaN
31624
2008-09-01 01:51
{'wind'
Match Units of Time
You also can use units of datetime values, such as hours or days, to identify rows for logical
indexing. This method can be useful for specifying periodic intervals.
For example, find the values of OutageTime whose month components have values of 3 or less,
corresponding to January, February, and March of each year. Use the resulting logical array to index
into TT.
TR = (month(TT.OutageTime) <= 3);
winterTT = TT(TR,:);
head(winterTT,5)
ans=5×5 timetable
OutageTime
Region
Loss
Customers
RestorationTime
Cause
________________
_____________
______
__________
________________
____________
2002-02-01 12:18
{'SouthWest'}
458.98
1.8202e+06
2002-02-07 16:50
{'winter sto
2003-01-23 00:49
{'SouthEast'}
530.14
2.1204e+05
NaT
{'winter sto
2003-02-07 21:15
{'SouthEast'}
289.4
1.4294e+05
2003-02-17 08:14
{'winter sto
2002-03-16 06:18
{'MidWest' }
186.44
2.1275e+05
2002-03-18 23:23
{'severe sto
2005-02-04 08:18
{'MidWest' }
NaN
NaN
2005-02-04 19:51
{'attack'
Create a pie chart of the wintertime causes. The pie function accepts only numeric or categorical
inputs, so first convert Cause to categorical.
winterTT.Cause = categorical(winterTT.Cause);
pie(winterTT.Cause)
title("Causes of Outages, January to March");
10 Timetables
10-22